Best Two Years in a Quarter-Century
In late 2022, a new bull market emerged from the ashes of a nine-month bear market, leading to 2023’s impressive rise of over 26% for the closely followed S&P 500 Index, according to S&P Global (including dividends reinvested).

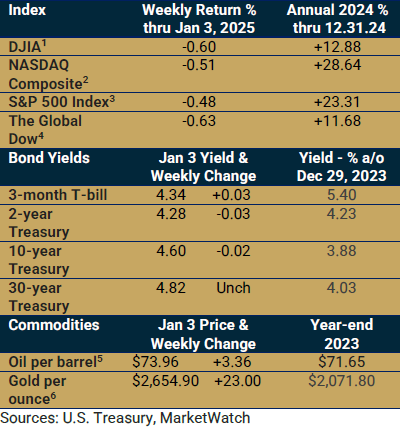
Cautious sentiment that characterized early 2024 did not hinder another impressive year, as the S&P 500 posted an advance of 23.31%, including 57 record closes (Wall Street Journal). Large-cap stocks, specifically large-cap growth, were the top-performing asset class in 2024 and annualized for the past five years.
Reinvesting dividends, the S&P 500 rose 25%. As we saw in 2023, seven large-cap tech names, dubbed the Magnificent 7, accounted for more than half of the S&P 500’s advance, according to Dow Jones Market Data and Barron’s.
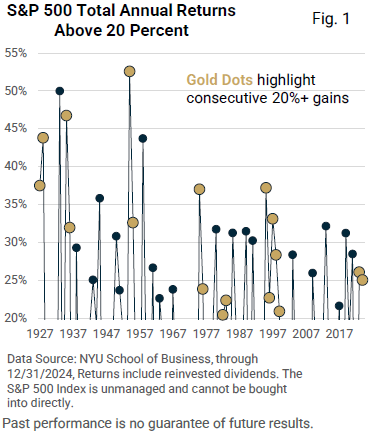
Since 1926, the S&P 500 has managed back-to-back annual gains above 20% only seven times, including 2023-2024 (Figure 1).
With the exception of five straight annual increases above 20% starting in 1995, the S&P 500 has never achieved three consecutive year-over-year gains greater than 20% (dating to 1926: up 11%).

The best and brightest didn’t foresee a blockbuster 2024, according to the 2024 CNBC Market Strategists survey.
In hindsight, it’s not difficult to Monday-morning quarterback the year.
The S&P 500 Index finished 2024 at 5,882. The average forecast among 13 well-respected analysts was 4,880, which, if realized, would have amounted to a rise of just 2.3%.
Instead, analysts played catchup as they revised forecasts higher during the year.
For 2023, analysts had expected a minor decline, according to CNBC.
Instead, the market roared. For 2022, the average forecast called for a gain of 5% for the S&P 500 (CNBC survey). Yet, the index lost nearly 20%.
As we’ve demonstrated, forecasts don’t always pan out. Still, market strategists bring unique observations to our attention. We are better informed thanks to their due diligence and insights.
Approaching Portfolios Like Chess Instead of Poker
It is important to remember a key philosophy of long-term disciplined investing is strategic asset allocation utilizing a diversified portfolio construction that accounts for both return AND risk.
Our strategy is to be chess masters (diversifying amongst many asset classes over the long term) instead of putting it all on one poker player (for example, large-cap stocks, i.e. S&P 500, in the short term).
In poker, anyone can get a lucky hand and beat even the best players. According to expert Annie Duke’s book Quit, professional players fold 75-85% of their hands in Texas Hold ’em. How much they win on the hands they play varies, but the point is relevant that about 80% of the time, chances are so low for even the professionals that it is smart not to play. This calls into question whether speculating with 100% exposure in one asset class is truly investing or simply gambling.
On the other hand, according to the International Chess Federation, there are about 1,850 grandmasters worldwide. These grandmasters would almost always beat a normal player when playing chess, a game with a higher impact of skill versus chance. This is why we try to focus on playing chess, using the skills and knowledge we have acquired over many decades of experience to hopefully give our investors a better chance of having appropriate risk-adjusted returns over time.
When all asset classes perform about the same, there is little chance for significant outperformance without leverage. If one asset class considerably outperforms all others (i.e. large-cap domestic), though, marked outperformance can be achieved only by taking a more speculative position in that one asset class.
Our discipline stops us from putting all of our eggs in one basket. The downside to diversifying and taking measured risks is that you can’t achieve the highest return scenarios. Instead, by following our process, our clients participated in the amazing large-cap domestic (S&P 500) results while diversifying their risk amongst a wide range of other asset classes.
Before we glimpse into 2025, let’s review the key themes that fueled last year’s advance.
First, the Federal Reserve reduced interest rates. While 2022 was a notable exception, rate hikes usually don’t kill bull markets, as we saw during the 2004 – 2006 and 2015 – 2018 rate hike cycles.
Conversely, easing cycles by the Fed don’t always fuel bull markets, including 2001 and 2008.
However, when rate cuts are accompanied by economic growth, they can create significant market tailwinds, as was experienced last year.
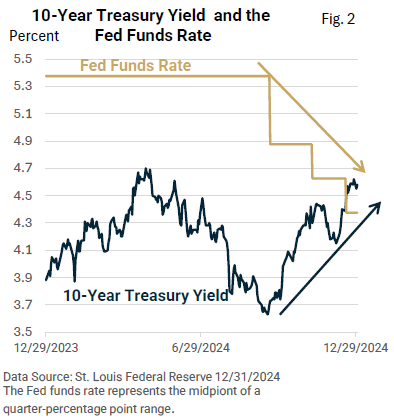
Through much of 2024, the Fed signaled plans to reduce rates, and the Fed didn’t disappoint, as it implemented three rate cuts in the second half of 2024, totaling a full percentage point.
Next, while the rate of inflation remains elevated, it has slowed, which encouraged the Fed to take its foot off the monetary brakes.
Moreover, economic growth has remained robust. While U.S. Gross Domestic Product (GDP), the broadest measure of economic activity, temporarily slowed to an annual pace of 1.6% in the first quarter (U.S. BEA), it accelerated to 3.0% in Q2 and 3.1% in Q3.
GDP has been 3% or higher over four of the last five quarters, averaging 2.7% since Q3 2023.
The economic soft landing that many had predicted was a no-show. Instead, let’s call it the ‘no-landing’ economy.
Lastly, that leads us to S&P 500 corporate profits, which have topped 10% annual growth over two of the last four quarters (through Q3 2024, LSEG).
A peek ahead
As we look ahead to 2025, the outlook remains positive. Before examining potential market risks, let’s first identify possible market catalysts.
These include economic growth, profit growth, a Fed that’s still eyeing rate cuts, deregulation, which aids both the economy and profits, a possible pick up in mergers and acquisitions, potential for lower corporate taxes, rising corporate stock buybacks, and US exceptionalism.
That totals eight potential catalysts that could underpin and support stocks in 2025.
Ultimately, much will likely depend on what happens to the economy.
The average forecast among 15 analysts places the S&P 500 for year-end 2025 at 6,643 per the CNBC 2025 survey.
That’s about a 13% advance from the 2024 year-end closing price of 5,882.
But strategists grapple with human behavior and the unknown. As noted above, forecasts don’t always pan out.
Although a bullish case can be advanced for 2025, too much optimism doesn’t leave much room for disappointment.
Stocks are richly valued. When markets are priced for perfection, minor disappointments can lead to volatility.
Let’s review some of the risks.
A rebound in inflation forces the Fed to raise interest rates. But here’s where it gets tricky. If we turn the coin over, a more cautious Fed misjudges the economy, and the economic outlook deteriorates.
Although the odds of a recession are low, economic forecasting is an inexact science.
There has been no shortage of optimism that the incoming Trump administration will usher in business-friendly policies.
However, his pledge to enact sweeping tariffs could raise prices and slow economic growth.
In 2018, he selectively imposed tariffs, which generated market volatility and uncertainty.
Despite multiple Fed rate cuts, longer-term bond yields turned significantly higher over the last three months amid slower progress on inflation, upbeat economic growth, and a stubbornly high federal deficit.
A continued rise in yields risks stiffer headwinds for stocks.

Might the AI revolution run into obstacles or fail to live up to high expectations?
As we wrap up the year, let’s make one final observation.
Figure 3 is an excellent reminder that stocks have a favorable long-term track record, but the ride higher has not been without bumps, pullbacks, and bear markets.
The average annual rise since 1980 for the S&P 500 Index was 13.2% (Figure 3).
Yet, during the year, the average maximum pullback was 14.0%.


