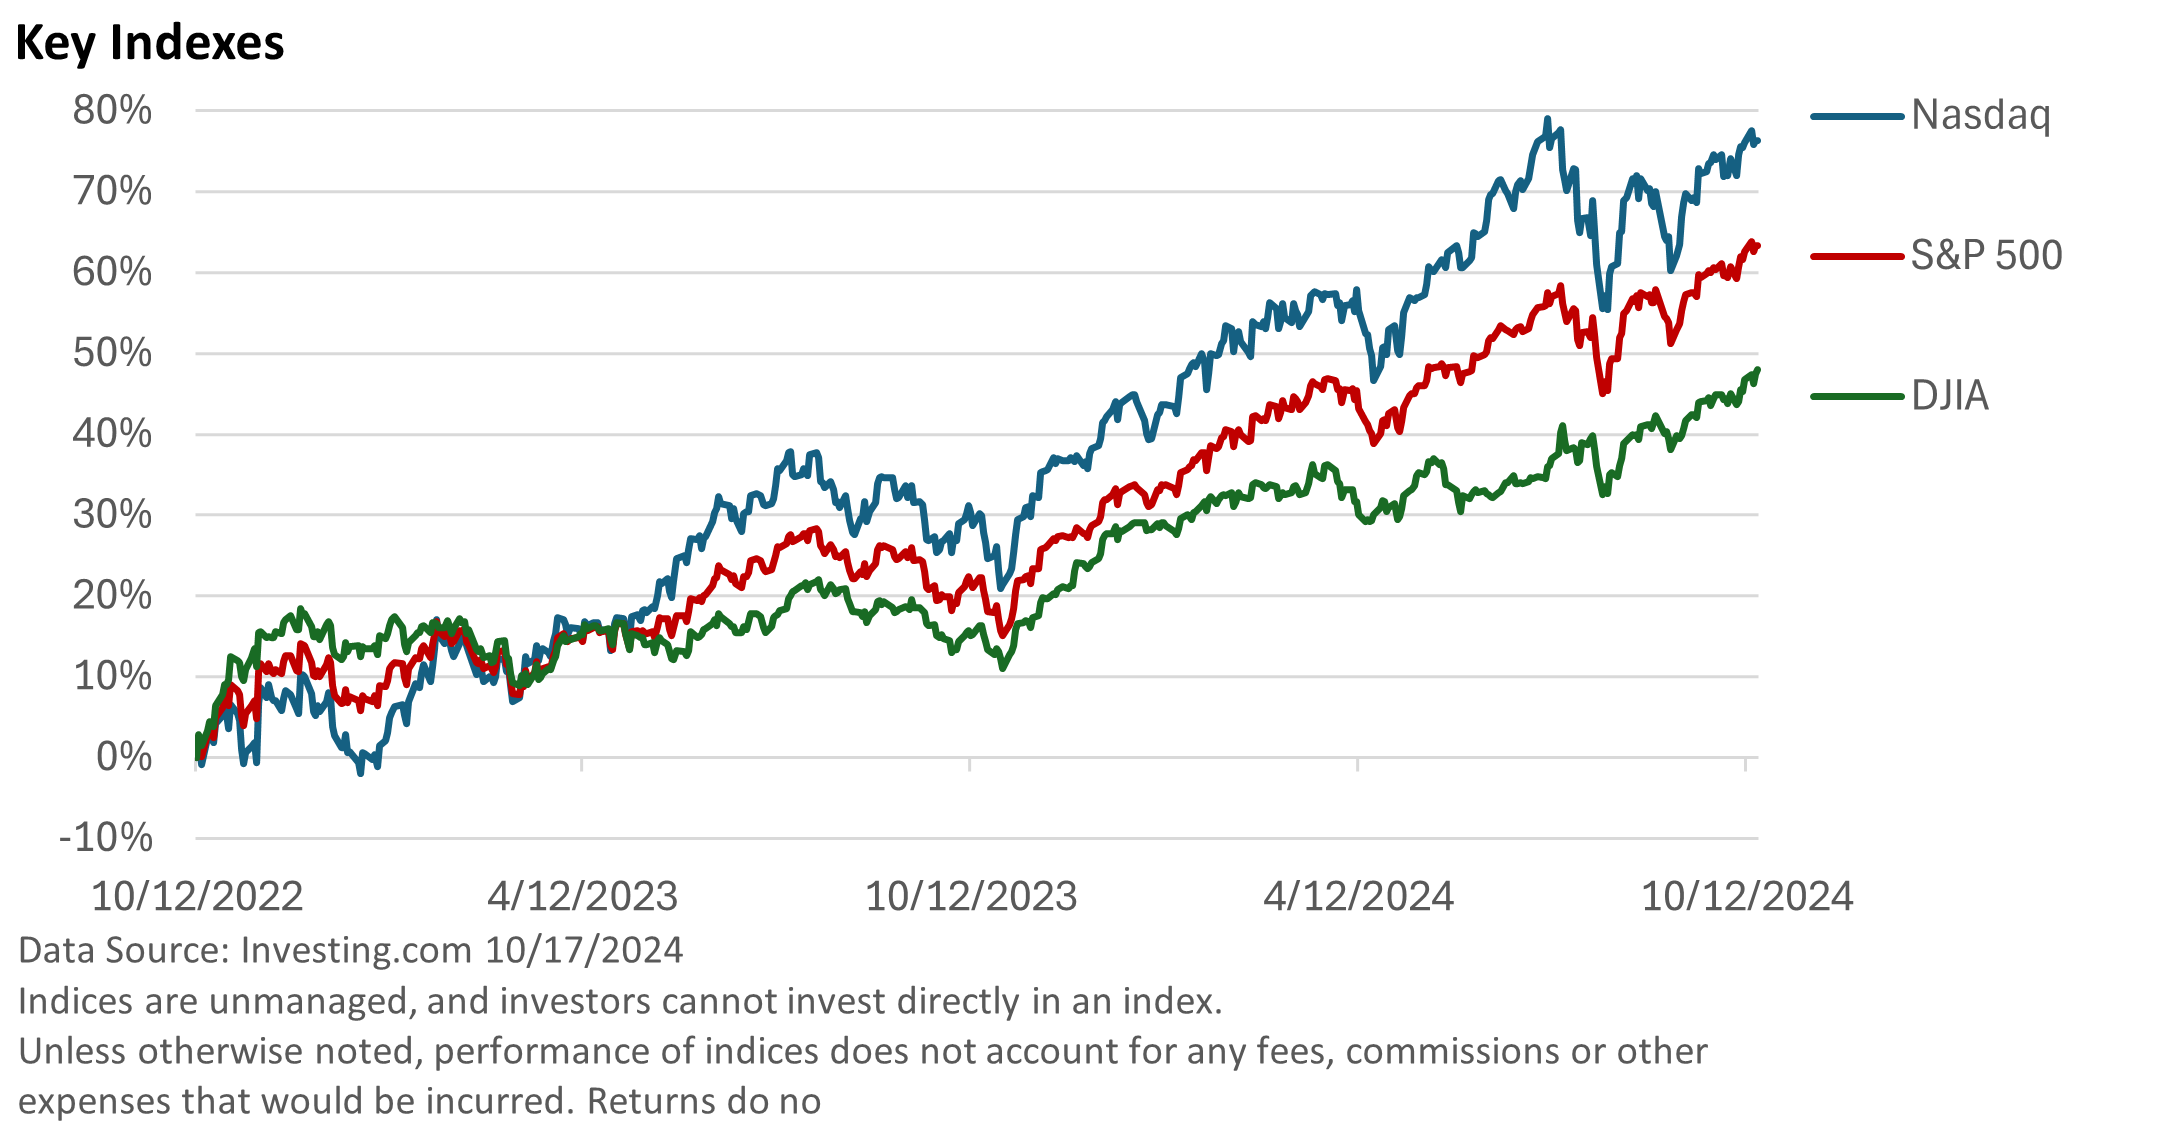
The bull market turned two years old last week. Since bottoming, the S&P 500 Index has climbed almost 64% (through 10/17/24). The index is up 22% from its early 2022 peak, according to data from the St. Louis Federal Reserve. Following the 2022 peak, the S&P 500 entered a nine-month bear market, shedding 25%.

But not all indexes are created equally. The Nasdaq takes top honors, as shown in the illustration above. The Nasdaq Composite is weighted toward technology firms, and the AI revolution has helped fuel outsized gains.
The S&P 500 Index takes second place. It is what’s called a market-capitalization-weighted index, which means the largest companies have an outsized influence over the index.
Since the start of the new bull market, the largest companies in the index have, on average, outperformed the smaller firms, contributing to the overall performance.
According to S&P Global, the top 10 stocks in the S&P 500 would be up about 100% over the last two years. They account for over 30% of the entire S&P 500 Index, according to Slickcharts.
The Dow Jones Industrial Average utilizes a different method. Still, it’s up a respectable 48%. Like the S&P 500, it has repeatedly set new highs this year.
While the rally has been concentrated in the larger companies, a measure that equally weights all S&P 500 companies has advanced a still-solid 42%, according to S&P Global.
Forces driving the bull market
The answer to the question is pretty simple: it’s the economic fundamentals.
While prices for goods and services are high, the rate of price hikes has slowed, which allowed the Federal Reserve to reduce the pace of rate hikes in late 2022 and into 2023.
You see, investors aren’t as concerned about the level of prices. Instead, they focus on the rate of change, and the rate of change has moderated significantly.
Eventually, the fed funds rate plateaued, and the Fed finally announced a rate cut last month. Moreover, the economy is still growing, which is supporting the growth of corporate profits.
In other words, the combination of stable/decreasing interest rates and profit growth is benefiting stocks.
Bear markets
Bear markets, defined as a 20% or greater decline in the S&P 500, have historically been associated with recessions.
Since the mid-1960s, only two bear markets have deviated from this historical pattern, according to St. Louis Federal Reserve data.
First, the one-day market crash of 1987, which was driven by computer program trading, and second, the bear market of 2022, which can be traced to the Fed’s aggressive series of rate hikes.
As we enter the last two months of the year, any number of factors could create unwanted volatility in the market. We know from experience that market pullbacks can occur at any time and when they are least expected.
Yet, the factors supporting stocks over the past year are still relevant.


