Weekly Market Commentary
The market had a banner year in 2021, with the S&P 500 Index advancing over 25%, according to data from the St. Louis Federal Reserve. But tailwinds that fueled gains shifted dramatically in 2022. No longer were the economic fundamentals favorable.
With inflation proving to be much more stubborn than expected, policymakers at the Federal Reserve hiked interest rates at the fastest pace in over 40 years, surprising investors and sending stocks into a bear market.
Higher interest rates pressure equities for two primary reasons. First, higher rates compete for investors’ cash. Second, higher rates eventually slow economic growth, which pressures corporate profits.
Rate-hike cycles are not created equally. In the past, rate increases began prior to a level considered to be full employment, proactively striking out against inflation.
Last year, the Fed’s posture was reactive, raising rates after the inflation genie was out of the bottle. And it did so forcefully.
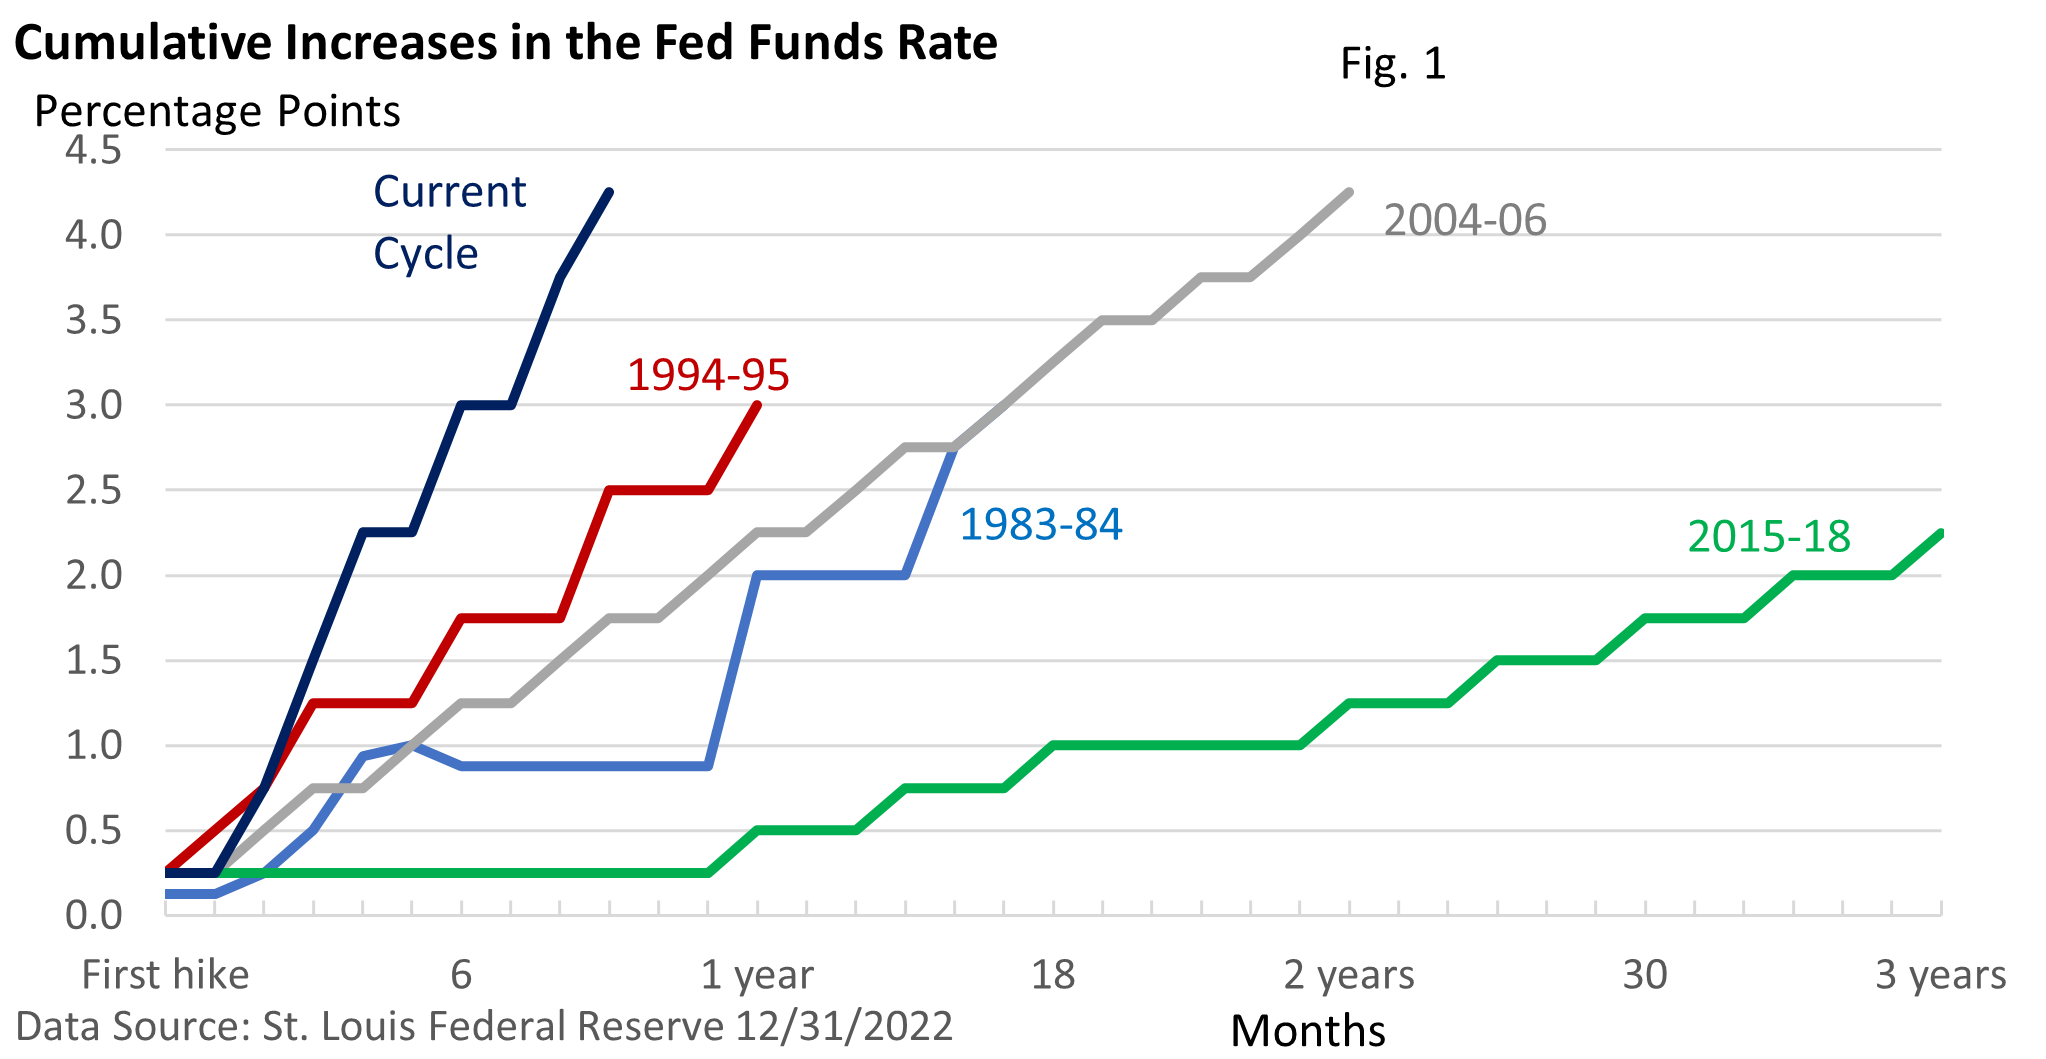
Figure 1 illustrates the first-rate hike cycle following a recession, dating back to the 1981-82 recession.
The current cycle is by far the most aggressive—4.25 percentage points in just 10 months. Today’s cycle has only been topped once. In the second half of 1980, the Fed raised the fed funds rate by a whopping 10 percentage points in just six months.

Table 2 illustrates the return of the S&P 500 Index (without dividends reinvested) from the first rate increase to the final increase in each series of increases.
Table 2: Stock Market Performance—First to Final Rate Hike in Each Cycle
| Rate Hike Cycle | S&P 500 Index Return |
| 1983 – 84 (16 months) | 7.9% |
| 1994 – 95 (12 months) | -2.1% |
| 2004 – 26 (24 months) | 12.0% |
| 2015 – 18 (36 months) | 20.8% |
| 2022 –? | -9.9% |
Data Source: St. Louis Federal Reserve, 12/30/2022
Past performance is no guarantee of future results. Return excludes dividends.
The S&P 500 Index is an unmanaged index which cannot be invested in directly.
The two most aggressive cycles—1994 and 2022—created the stiffest headwinds for investors. Stocks performed best during the very gradual moves during 2015—2018.
In fact, the S&P 500 Index was up over 40% between December 2015 and September 2018 before shedding about half of its gain during the final three months, as recession concerns surfaced.
Looking ahead, the Fed expects to slow the pace of rate hikes this year but has also signaled that it could maintain a peak rate over a longer period, as it hopes to wring inflation out of the system.
But be aware that a glance into the future is murky at best. The Fed’s own forecast one year ago envisioned rates hikes totaling just 0.75-percentage points for the entire year. Even the smartest folks in the room aren’t exempt from a bad forecast.
While inflation remains too high, the rate has moderated. After peaking at a 40-year high of 9.1% in June, the Consumer Price Index (CPI) slowed to 7.1% as of November.
The core CPI, which strips out food and energy, hit a peak of 6.6% in September and has eased to 6.0% as of November (U.S. Bureau of Labor Statistics).
But it remains well above the Fed’s annual goal of 2%.
Blame the war in Ukraine, which disrupted traffic in commodities including wheat and oil, for the much bigger jump in the headline CPI.
Lessons from the past
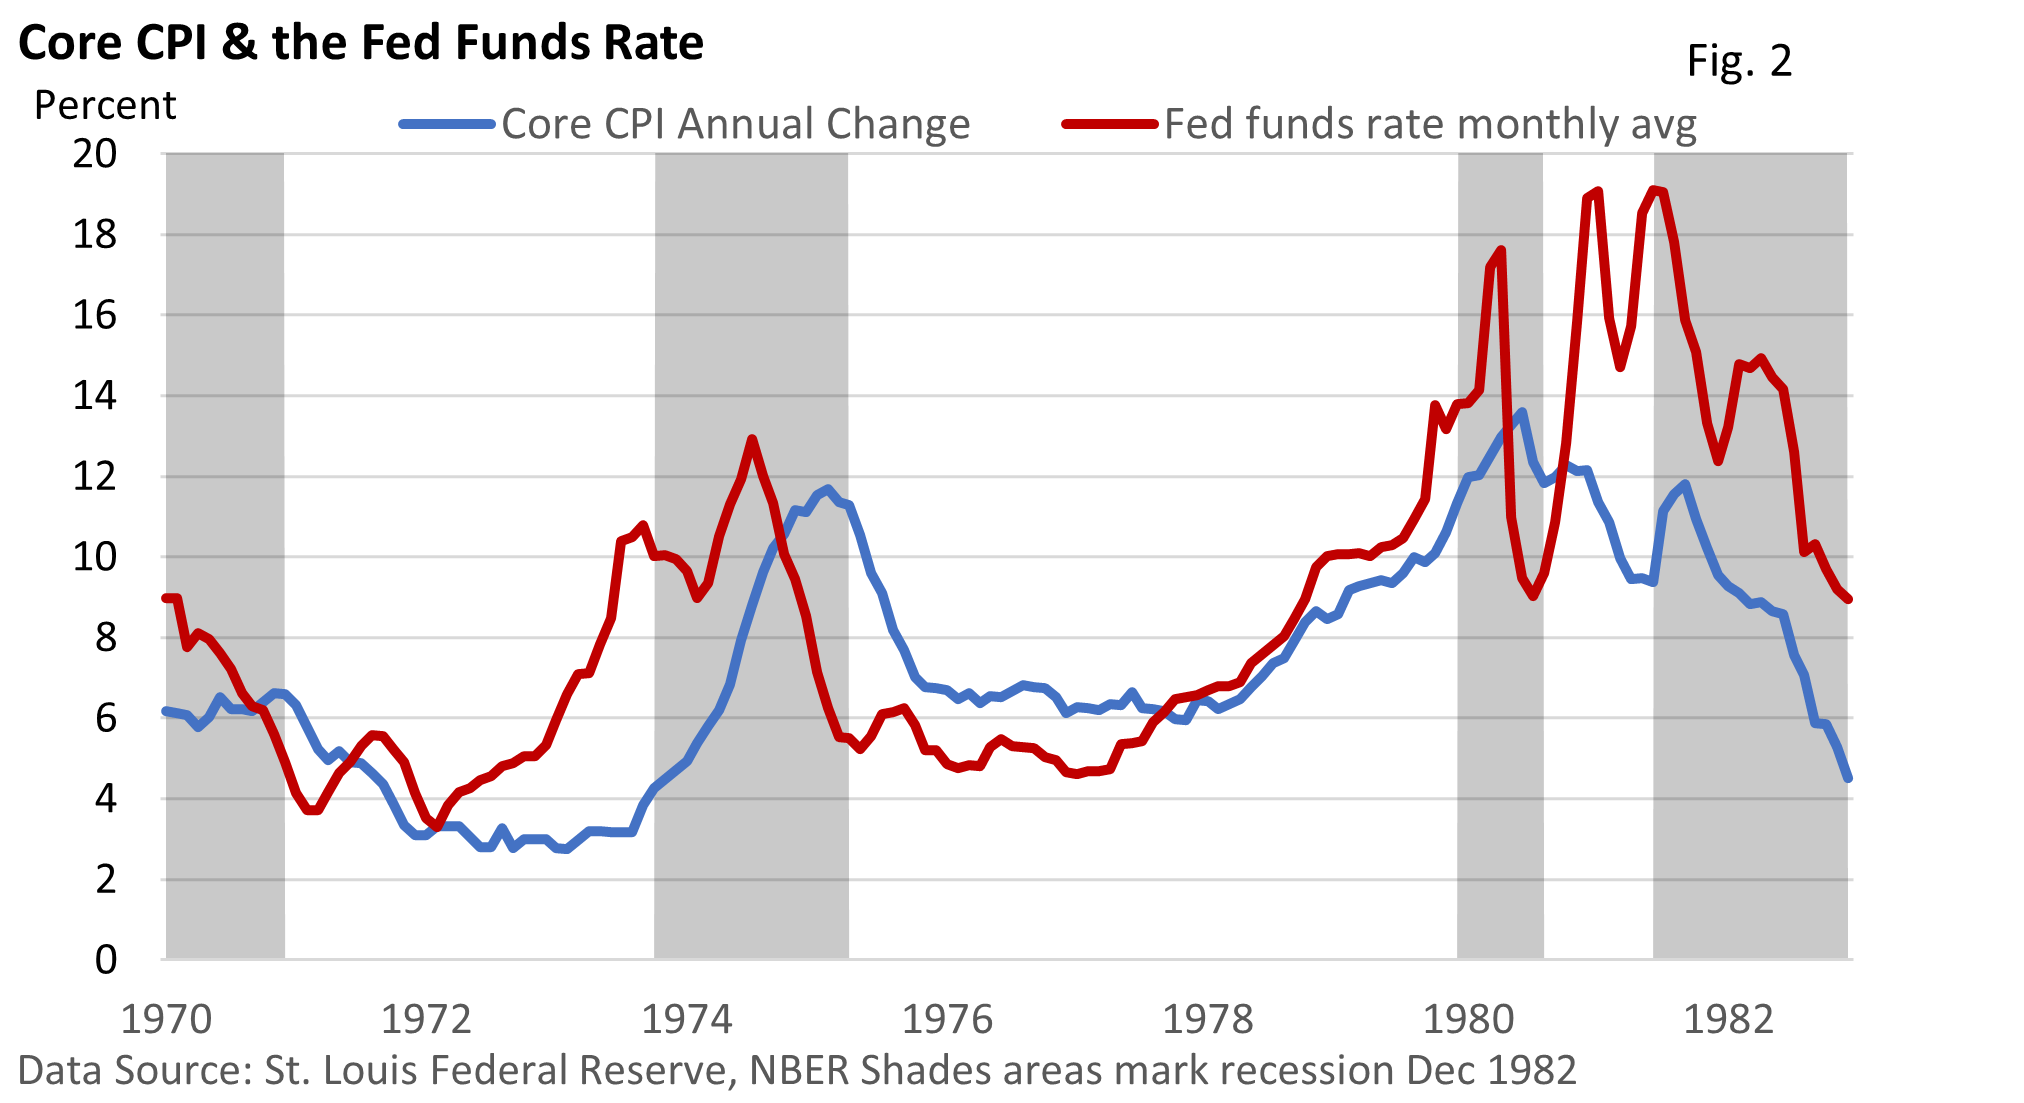
Whether we agree or disagree that the Fed’s tough posture is the right medicine, its decisions are rooted in the lessons of the 1970s.
In the mid-1970s, the Fed sidelined its fight against inflation while prices were still rising between 6% and 7% per year. Inflation roared higher in the late 1970s and peaked at nearly 14% in 1980. Inflation was fully embedded in the economy, which required a massive response.

Inflation turned lower, but the cost was a steep recession. By acting forcefully now, the Fed hopes to avoid a repeat. However, do not expect prices to return to pre-pandemic levels.
A look ahead—hard landing or soft landing
The Fed’s actions have raised fears that the economy is on a collision course with a recession—a hard landing.
“Usually, recessions sneak up on us. CEOs never talk about recessions,” said economist Mark Zandi of Moody’s Analytics. “Now it seems CEOs are falling over themselves to say we’re falling into a recession. … Every person on TV says recession. Every economist says recession. I’ve never seen anything like it.”
If we slip into a recession, rate hikes would probably cease, and we might see a series of rate cuts. But corporate profits would turn lower, too.
Yet, a recession is not a foregone conclusion. A resilient labor market and a sturdy consumer, with borrowing power and some pandemic cash still in the bank, could help keep the economy on a gradual but upward path.
Long-term optics
As the economy expands over a long period, corporate profits rise as well. A well-diversified portfolio enables an investor to tap into that longer-term growth.
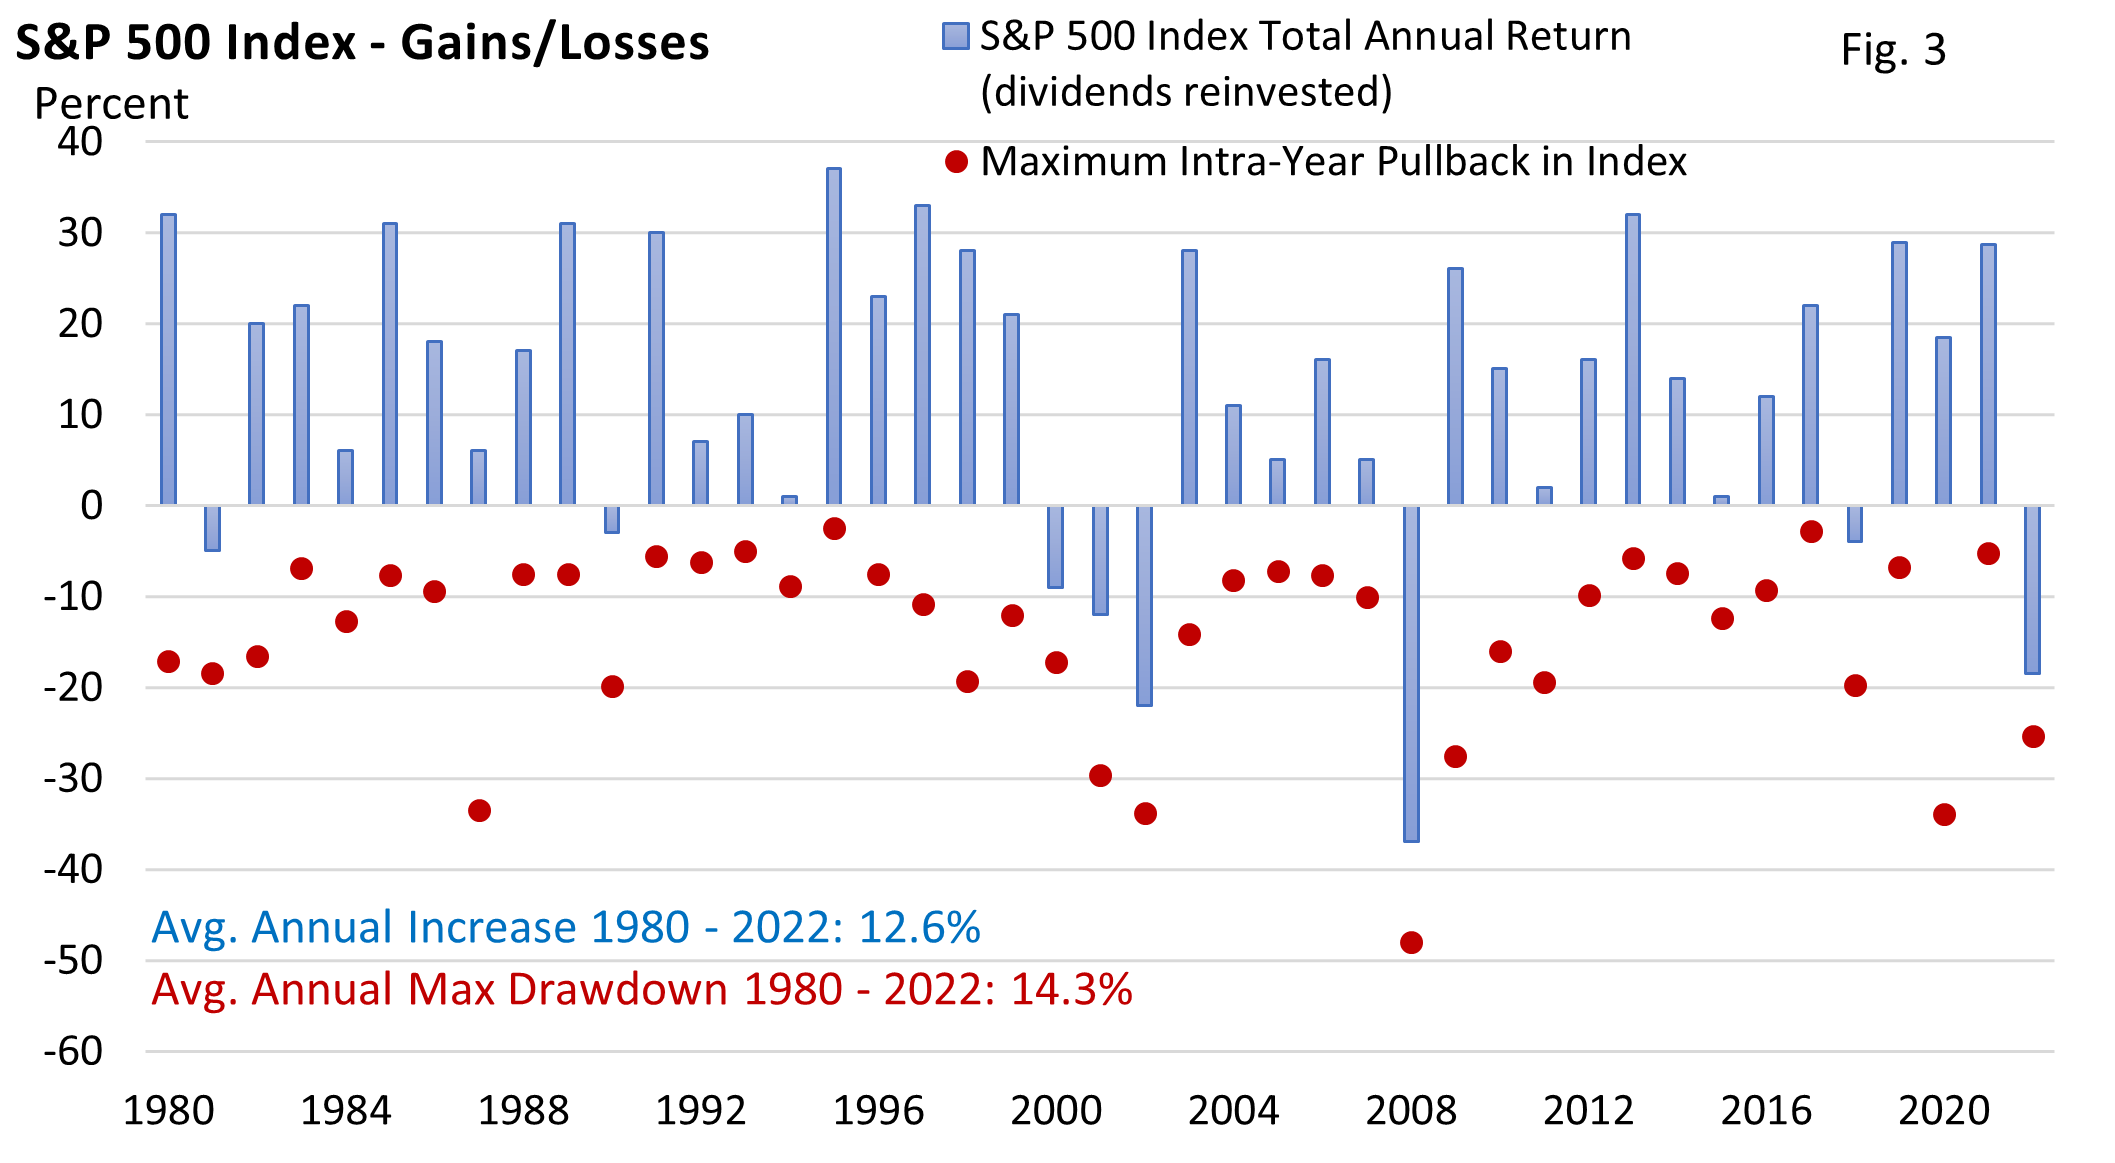
Let’s review Figure 3. The S&P 500 Index has averaged a 12.6% annual return, dividends reinvested, since 1980.

Up years accounted for 81% of the period surveyed. Simply put, historically, stocks perform well over a longer period, but pullbacks are common, too.
Fourteen times, stocks ended a year higher after the S&P 500 had an intra-year peak-to-trough selloff of over 10%.
Notably, stocks performed exceedingly well in 1985, 1995, and 2019. These years marked the first year after a Fed rate-hike cycle when the Fed engineered a soft landing.
We may not avoid a recession next year, and sentiment heading into 2023 is unsettling. However, if we were to take a contrarian view, any positive surprises could be a catalyst for gains next year.
For example, a sharp slowdown in inflation, without a recession, that encourages the Fed to adjust policy.
Still, let’s acknowledge that any look ahead is informed by today’s landscape. Peering into the future is an exercise in uncertainty. Surprises, both positive and negative, are to be expected.
Investor’s corner
A financial plan is never set in concrete. It is a work in progress and can and should be adjusted as life unfolds.
When stocks tumble, some investors become very anxious. When stocks are posting strong returns, others feel invincible and are ready to load up on riskier assets.
We caution against making portfolio adjustments that are simply based on market action.
Remember, the financial plan is the roadmap to your financial goals. In part, it is designed to remove the emotional component that may encourage you to buy or sell at inopportune times.
That said, has your tolerance for risk changed considering this year’s volatility?


