



author avatar
admin

Feb 6, 2017

Financial Market Summary and Outlook

FDP Header Financial Market

January 2017

Good vs. Average

2016 was a very good year for diversifed portfolios as returns were boosted by exposure to diversifer asset classes, meant to provide additional risk adjusted return over time. This is a welcome turnaround from 2015, when most diversifer asset classes trailed large cap US stocks as represented by the S&P 500 Index. If you use the S&P 500 Index as your yardstick, then 2016 turned out to be an average year for stocks. Going back to 1928, the average annual return, including reinvested dividends, runs nearly 10% (NY Stern School of Business data). When the year had ended, the S&P 500 rose 9.54%. Throw in dividends and 2016 rose 11.96% (Morningstar). Mid-cap and smaller company shares topped 20%.. SEE MORE…..
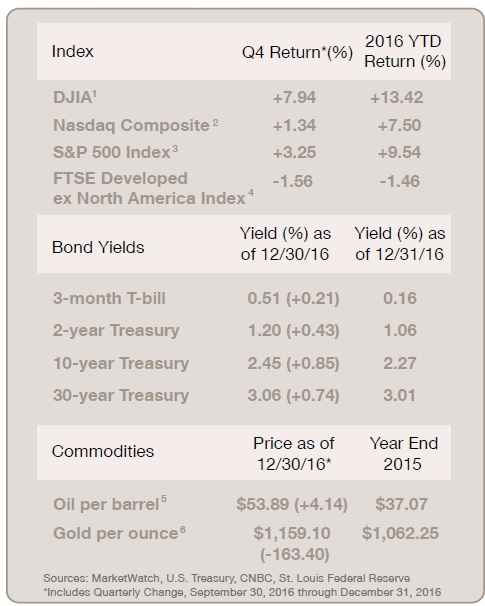
Index Graphic

A Look Back at 2016

The year finished on a solid note, but 2016 didn’t start out that
way. Falling oil prices, worries about China, an upward lurch in
junk bond yields, and overblown fears of a recession took a big
toll on investor sentiment. CNNMoney pointed out that the first
ten days of the year were the worst start for the Dow in its history
– that’s going all the way back to 1897. To compound the angst,
comparisons to 2008 were rife. However, this wasn’t 2008, there
wasn’t a subprime crisis that was brewing, and shares touched
bottom in early February (St. Louis Federal Reserve). SEE MORE….


Reproduction Prohibited without Express Permission. Copyright FDP Wealth Management. All rights reserved. Advisory Services offered through FDP Wealth Management, LLC, a state Registered Investment Adviser and Valmark Advisers, Inc. a SEC Registered Investment Advisor. Securities offered through ValMark Securities, Inc., Member FINRA/SIPC. 130 Springside Drive, Suite 300, Akron, OH 44333-2431 800.765.5201 Prosperity Partners and FDP Wealth Management, LLC are separate entities from ValMark Securities, Inc. and Valmark Advisers, Inc. Prosperity Partners, FDP Wealth Management, LLC, ValMark Securities, Inc., Valmark Advisers Inc., and their representatives do not offer tax advice. You should consult your tax professional regarding your individual circumstances. Indices are unmanaged and cannot be invested directly in. Past performance is not a guarantee of future results.

Indices are unmanaged and do not incur fees, one cannot directly invest in an index. You should consult your tax professional regarding your individual circumstances. This information is provided by Financial Jumble, LLC. Financial Jumble, LLC is a separate entity from ValMark Securities, Inc. and ValMark Advisers, Inc.

RELATED POSTS

A Hotter August CPI Builds Rate Hike Momentum

First, let’s clarify that any attempt to predict the Federal Reserve’s actions this week is, at best, an educated guess. Fed Chair Kevin Warsh has struck a hawkish tone, and the odds of a quarter-point increase in the fed funds rate are 87%, according to the CME Group. It was 59% on September 4.

Behind the Jobs Report

On Friday, the US Bureau of Labor Statistics (BLS) reported that nonfarm payrolls rose by a much greater-than-expected 162,000 jobs in August. The unemployment rate held steady at 4.1%.

Location Location Location

The graphic below compares the change in home prices, adjusted for inflation, for various US cities. For example, the average USA home price has topped inflation by 238% since 1948. Why has there been such a wide trajectory in prices, and why have they proven so persistent?

Rising Yields Faily to Derail Stocks

This year, the stock market has risen significantly. Lingering worries about oil prices, inflation, the war with Iran, and the possibility of an AI bubble haven’t subsided. But the economy is expanding, corporate profits have been strong, and the S&P 500 Index set a new high last week, according to the Wall Street Journal.

All Gas, No Brakes: Profits Soar in Q2

In a solid earnings season, we’d generally expect S&P 500 companies to deliver double-digit profit growth, meaning earnings growth of at least 10% versus a year ago (20% tops). That’s not a hard-and-fast rule, but it provides a useful benchmark for evaluating the strength of a quarter.