





author avatar
Mark Chandik

Jun 25, 2024

Mixed Signals

Weekly Market Commentary

Much has been made of the remarkable resilience of the American economy. Forecasters who confidently called for a recession in 2023 got it wrong. So far this year, the economy is generating new jobs, and the U.S. economy has yet to falter.

Notably, Barron’s pointed out, “The people in the know are often mistaken, sometimes spectacularly.” In most cases, they fail to foresee an impending recession.

Economic forecasting is an imperfect science. Economic models are quite complex, but each cycle has its own unique characteristics, which are typically confirmed in hindsight. Are there signs the economy is finally slowing down?

Last week, the U.S. Census Bureau released its monthly report on May retail sales. A review of the data suggests that consumers may have reached their spending limit.

The retail sales report offers us a peek at what consumers (you and I) are spending on goods such as autos, furniture, electronics, groceries, restaurants, sporting goods, and clothing. It does not include services such as leisure, entertainment, concerts, utilities, and hotels.

The graphic below illustrates that sales plateaued last September.
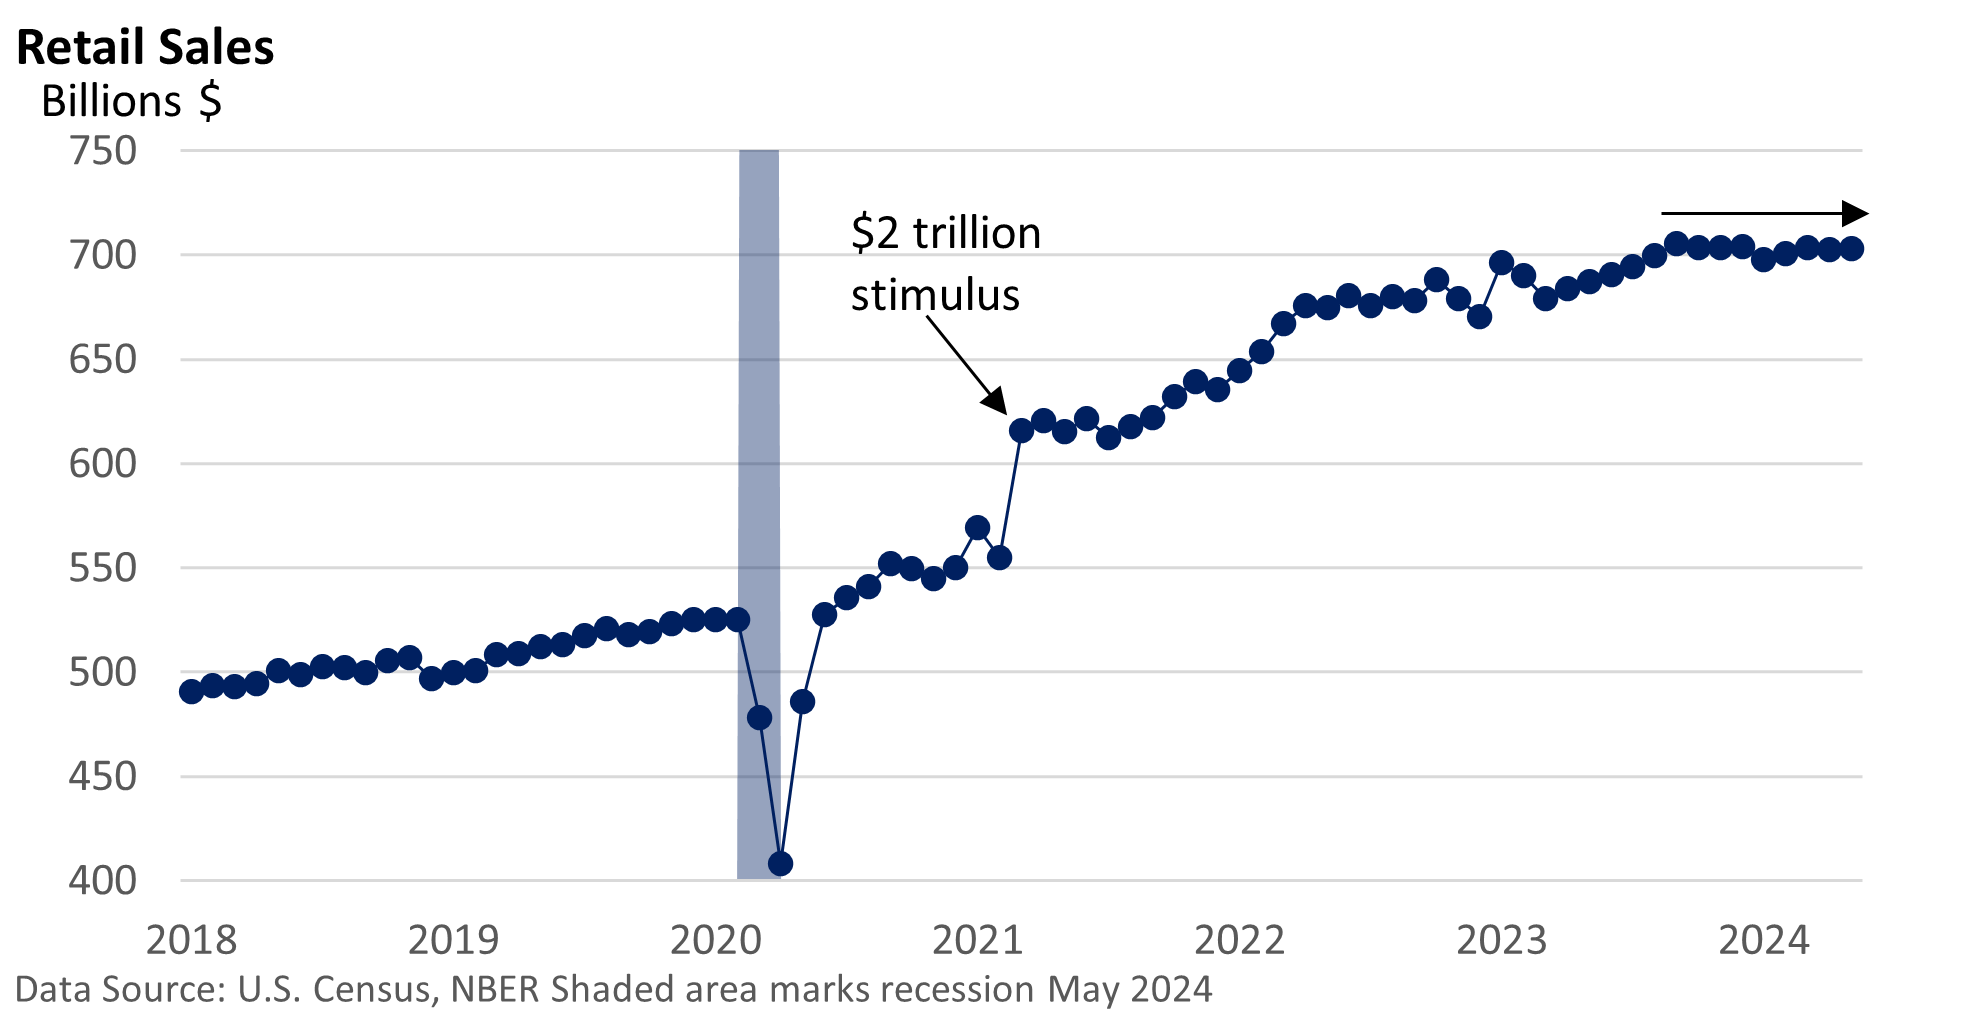
The report is important as retail sales make up about 30% of U.S. economic activity. When services are included, this number increases to just under 70% (according to St. Louis Federal Reserve data).

Yet, the latest from the Atlanta Federal Reserve signals that economic growth isn’t slowing. Its GDPNow model, which incorporates economic reports that directly impact Gross Domestic Product (GDP) in real-time, is tracking at 3.0% in Q2 (through June 18). That’s an impressive pace.

Q2 GDPNow includes April’s economic reports and most of the major May reports.

Is the economy about to flounder? Though it is difficult to provide a precise answer as the data are inconclusive and mixed, a lack of fuel from the consumer could take some wind out of the economic sails.

author avatar
Mark Chandik

Reproduction Prohibited without Express Permission. Copyright FDP Wealth Management. All rights reserved. Advisory Services offered through FDP Wealth Management, LLC, a state Registered Investment Adviser and Valmark Advisers, Inc. a SEC Registered Investment Advisor. Securities offered through ValMark Securities, Inc., Member FINRA/SIPC. 130 Springside Drive, Suite 300, Akron, OH 44333-2431 800.765.5201 Prosperity Partners and FDP Wealth Management, LLC are separate entities from ValMark Securities, Inc. and Valmark Advisers, Inc. Prosperity Partners, FDP Wealth Management, LLC, ValMark Securities, Inc., Valmark Advisers Inc., and their representatives do not offer tax advice. You should consult your tax professional regarding your individual circumstances. Indices are unmanaged and cannot be invested directly in. Past performance is not a guarantee of future results.

Indices are unmanaged and do not incur fees, one cannot directly invest in an index. You should consult your tax professional regarding your individual circumstances. This information is provided by Financial Jumble, LLC. Financial Jumble, LLC is a separate entity from ValMark Securities, Inc. and ValMark Advisers, Inc.

RELATED POSTS

The Fed Hikes Rates: What Investors Should Know

In his opening remarks in a speech last month at the Federal Reserve Bank of Kansas City’s Economic Symposium, Fed Chief Kevin Warsh said, “(Event) planners have some recreation options lined up for later today.

A Hotter August CPI Builds Rate Hike Momentum

First, let’s clarify that any attempt to predict the Federal Reserve’s actions this week is, at best, an educated guess. Fed Chair Kevin Warsh has struck a hawkish tone, and the odds of a quarter-point increase in the fed funds rate are 87%, according to the CME Group. It was 59% on September 4.

Behind the Jobs Report

On Friday, the US Bureau of Labor Statistics (BLS) reported that nonfarm payrolls rose by a much greater-than-expected 162,000 jobs in August. The unemployment rate held steady at 4.1%.

Location Location Location

The graphic below compares the change in home prices, adjusted for inflation, for various US cities. For example, the average USA home price has topped inflation by 238% since 1948. Why has there been such a wide trajectory in prices, and why have they proven so persistent?

Rising Yields Faily to Derail Stocks

This year, the stock market has risen significantly. Lingering worries about oil prices, inflation, the war with Iran, and the possibility of an AI bubble haven’t subsided. But the economy is expanding, corporate profits have been strong, and the S&P 500 Index set a new high last week, according to the Wall Street Journal.