Weekly Market Commentary
On Friday, the U.S. Bureau of Labor Statistics (BLS) reported that employers added 275,000 net new jobs in February. The hiring boom continues, right? Well, it’s not quite that simple.
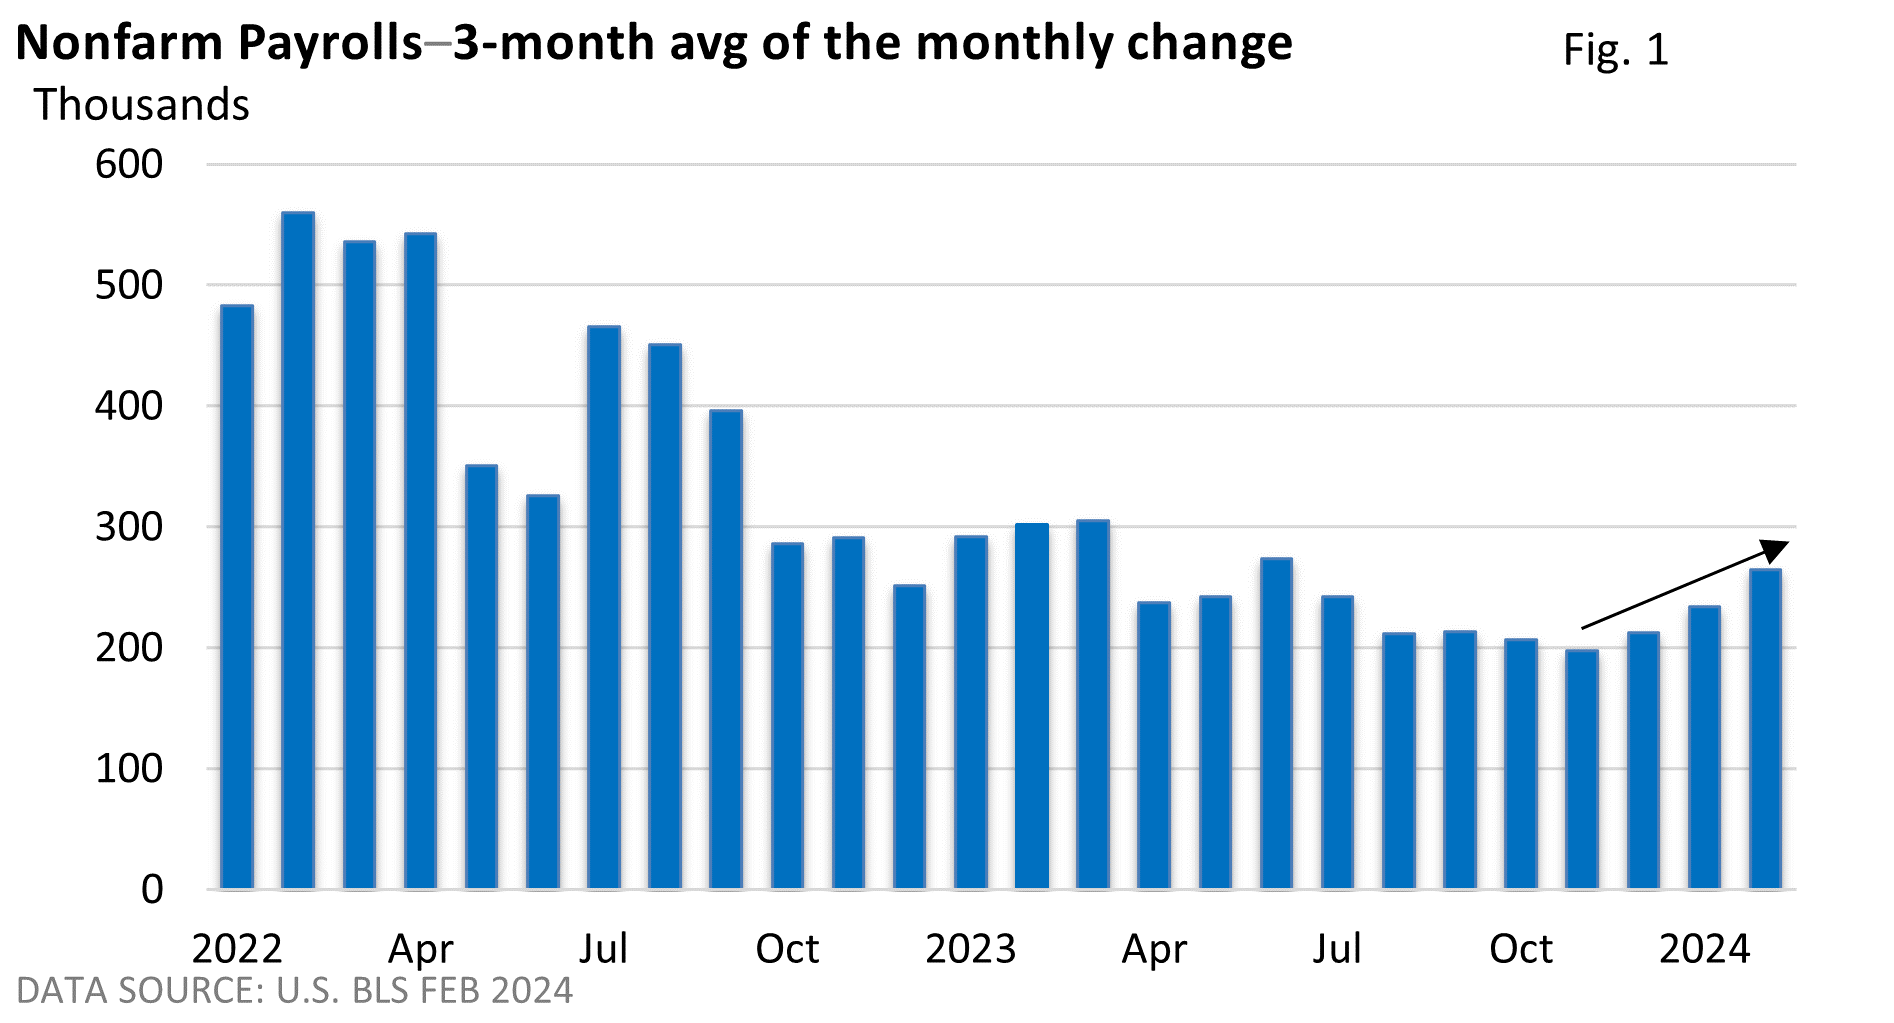
Let’s dive in. January’s red-hot increase of 353,000 was revised lower to a still-strong 229,000. But that’s an unusually large downward revision. A more comprehensive review uses the 3-month moving average, which is simply an average of the last three months (Figure 1).
It smooths away much of the monthly noise. It reflects an acceleration in new jobs.

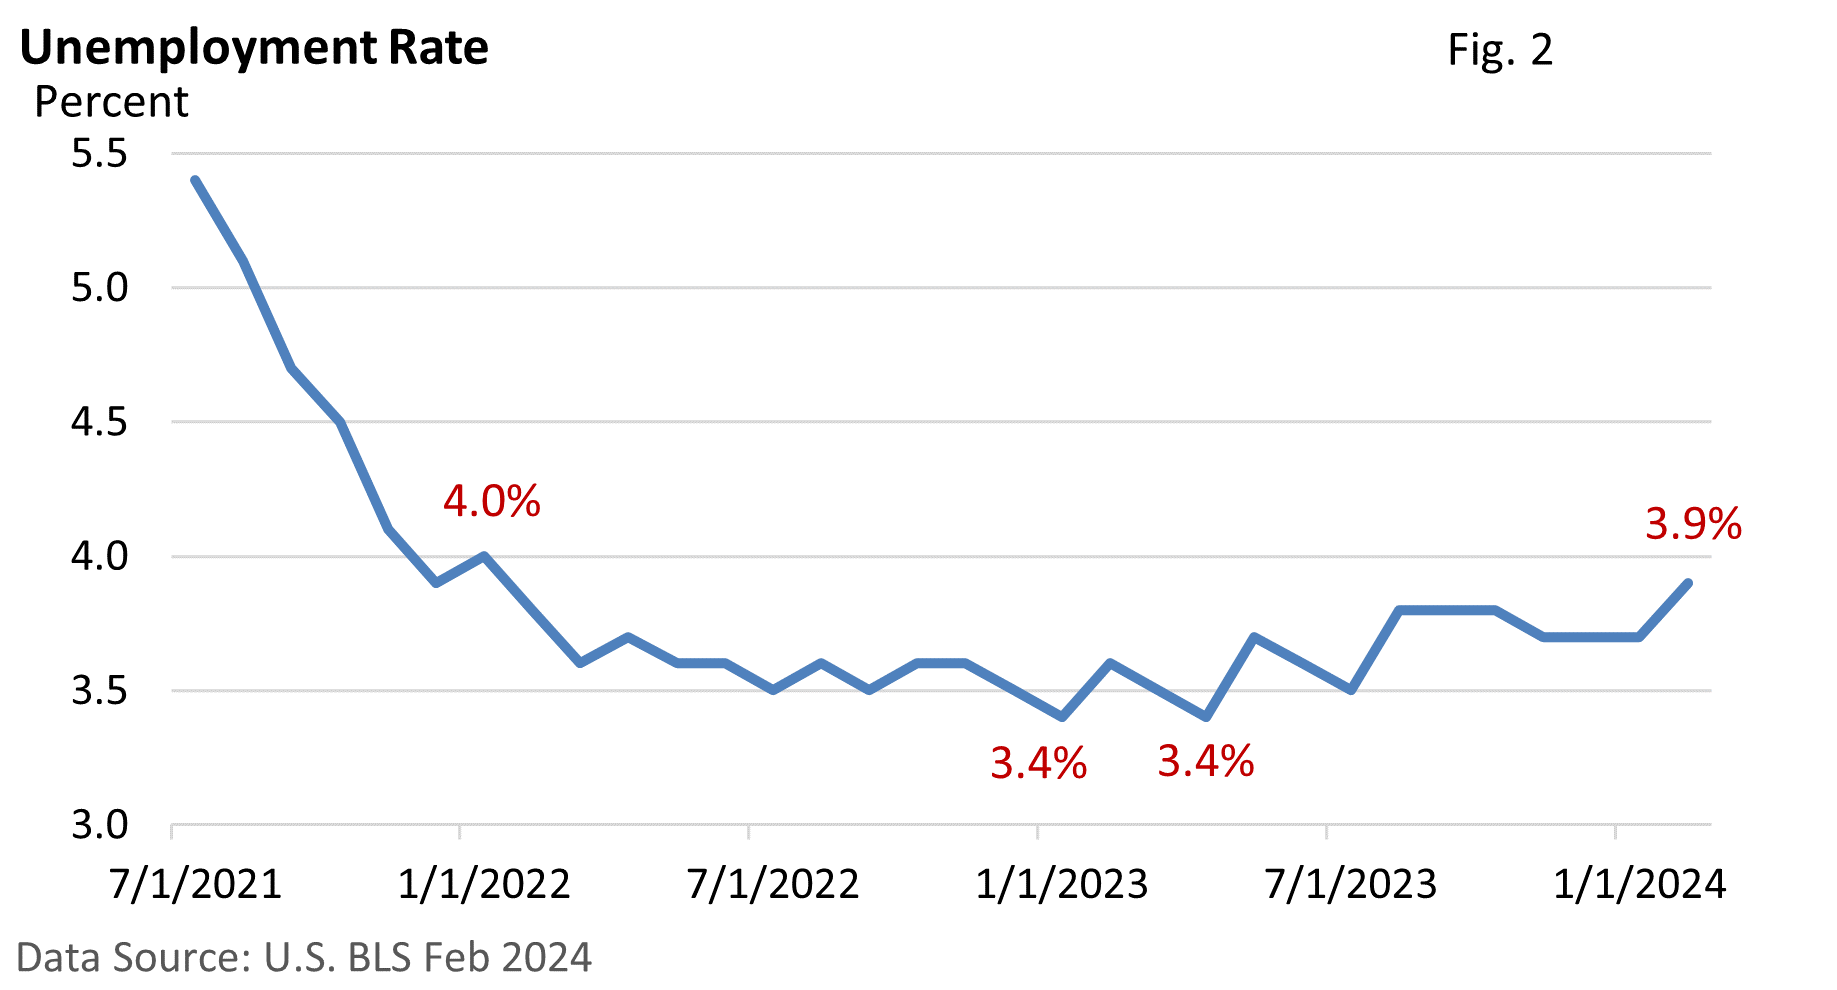
If that were the end of the story, we could conclude the labor market is solid. But the unemployment rate rose from 3.7% in January to 3.9% in February. It’s still low, but it’s at the highest reading since January 2022 (Figure 2).
How does the jobless rate rise when the number of jobs increases?
Nonfarm payrolls are derived from the Establishment Survey, a survey of businesses. The unemployment rate is taken from a separate survey called the Household Survey.

In part, more people are returning to the labor force following the pandemic; higher legal immigration may also be contributing.
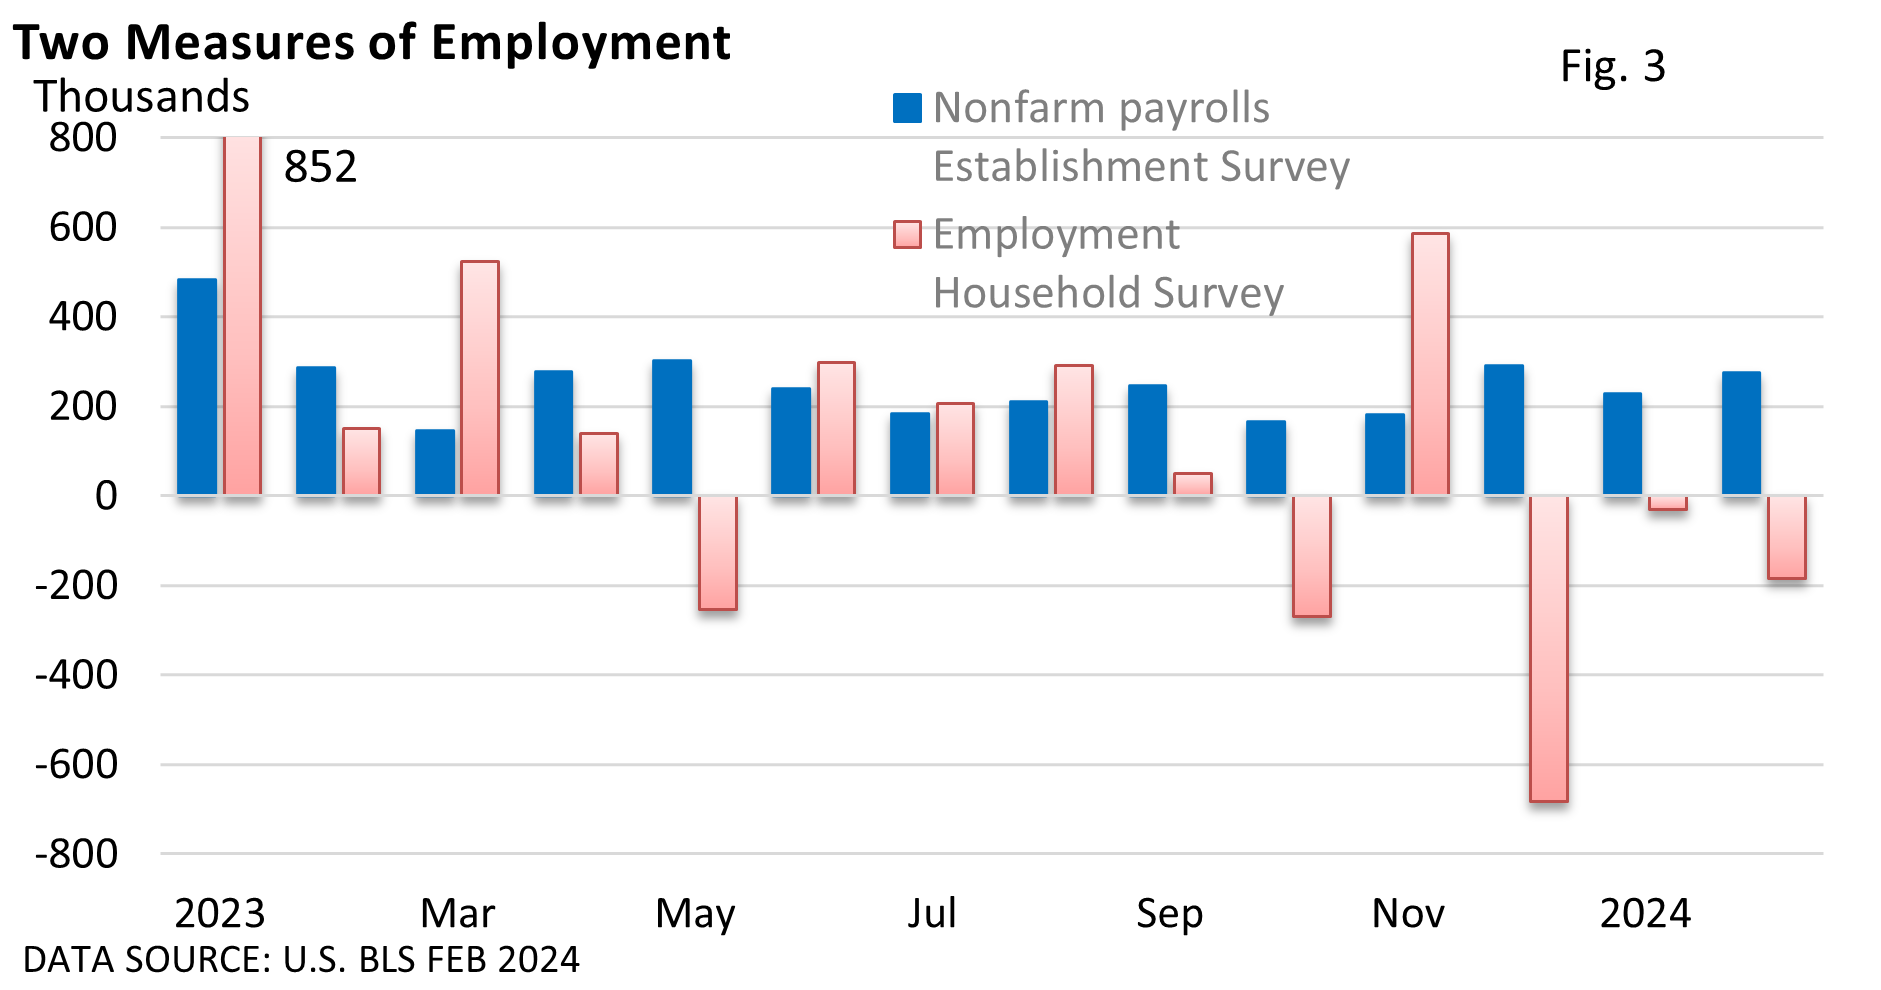
Employment in the Household Survey has been down in three of the last four months (Figure 3), a notable contradiction from what has been happening to nonfarm payrolls.

It’s unclear which survey best reflects the overall state of the labor market. Over a longer period, they tend to line up.
That said, the employment number is typically more volatile in the Household Survey than nonfarm payrolls, as illustrated in Figure 3, so economists focus on nonfarm payrolls when reviewing job trends.
The job openings report from the U.S. BLS still highlights that job openings remain high. Despite a number of high-profile layoff announcements, first-time claims for unemployment insurance from the Department of Labor remain low.
Besides, much of the data doesn’t point to significant economic weakness.
Let’s let the two employment numbers sort themselves out, i.e., let’s see how this plays out.


