Weekly Market Commentary
The slowdown in the rate of inflation last month was aided by food and energy prices. The Consumer Price Index rose 0.1% in March versus February amid a 3.5% decline in energy prices and no change in food prices (U.S. Bureau of Labor Statistics data). Grocery stores actually fell 0.3%, while food at restaurants jumped 0.6%.
Food and energy can be volatile, contributing to higher prices or reducing the rate of inflation.
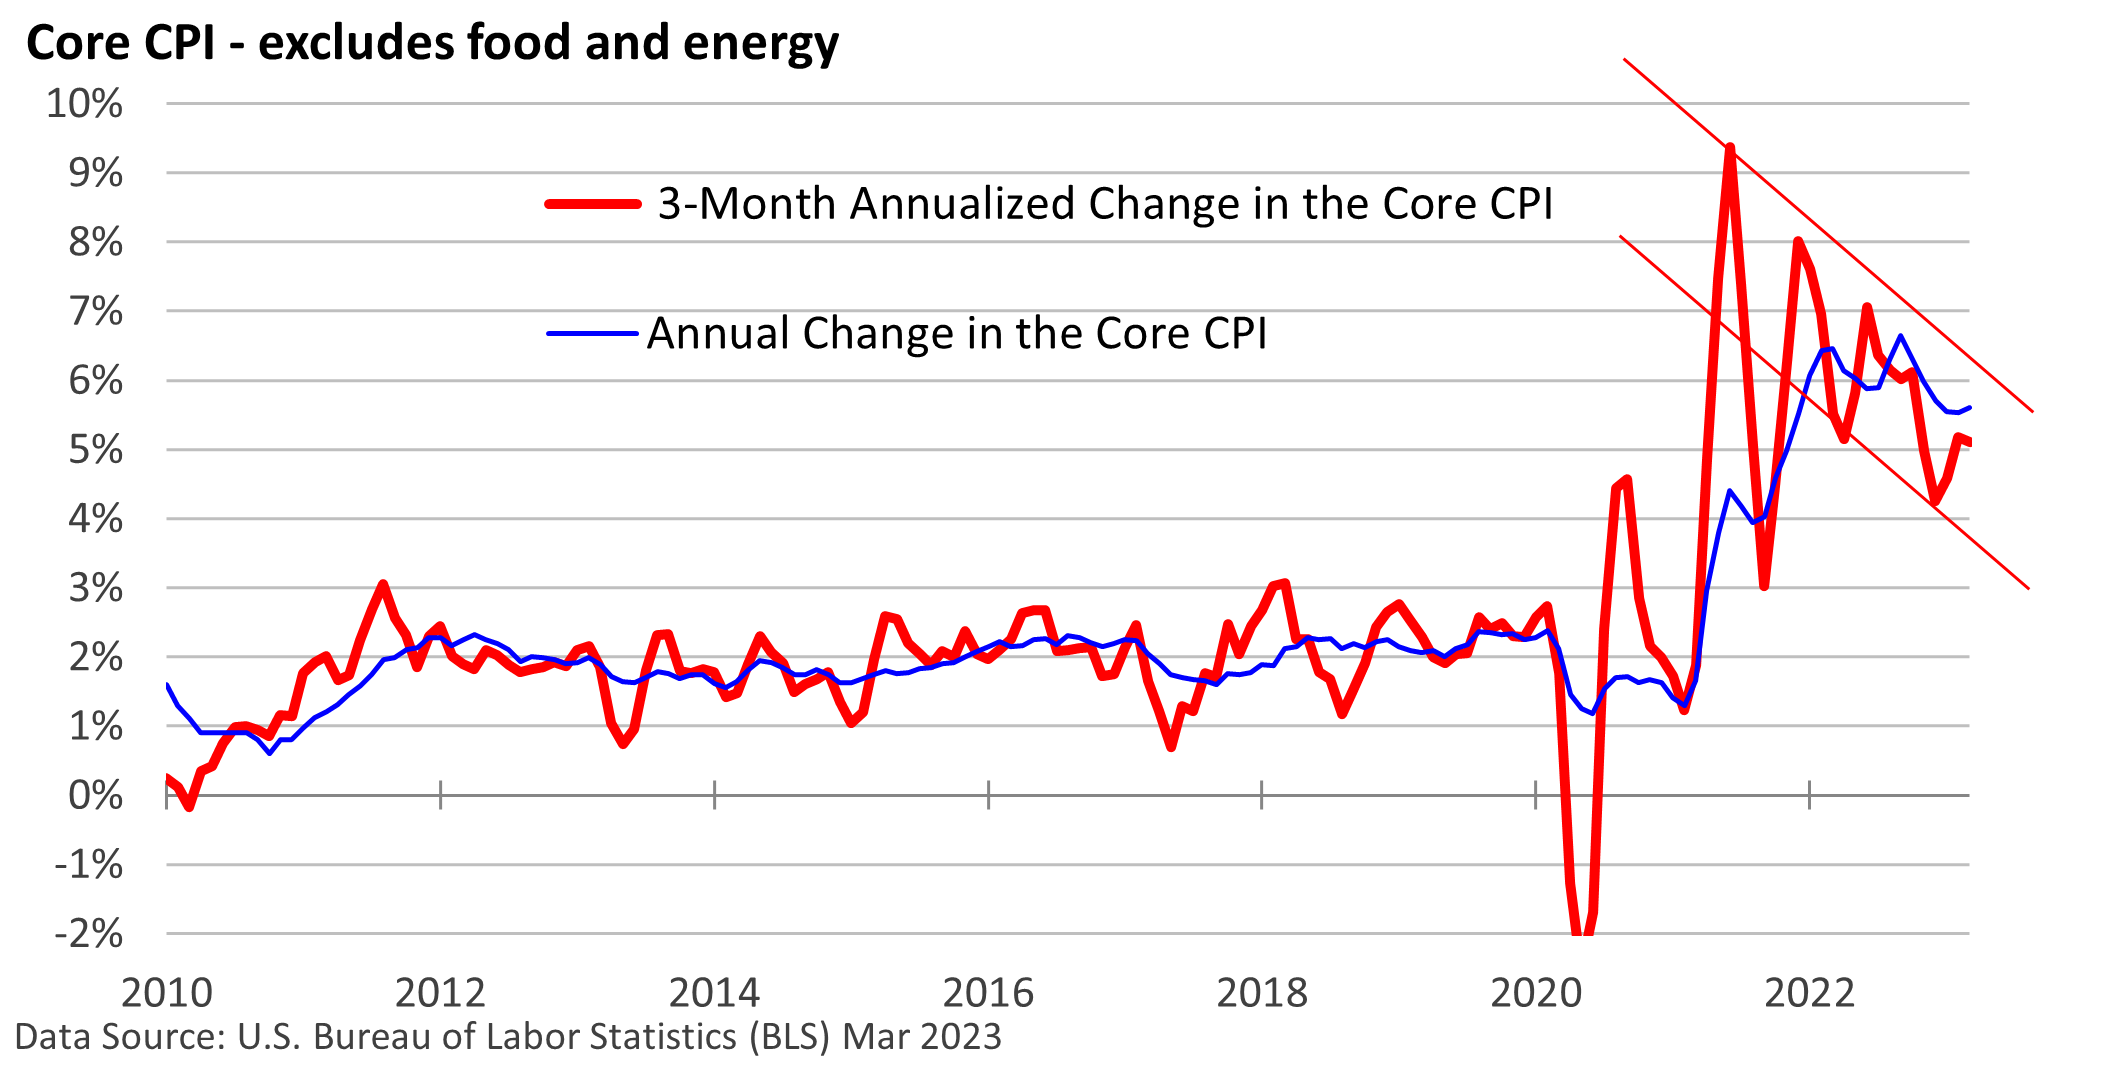
Economists consider energy and food but also look at what’s called core inflation. The core CPI removes food and energy. Last month, the core CPI rose 0.4%. It is up 5.6% versus one year ago and remains well above the Fed’s annual target of 2.0%.
The CPI is up 5.0% versus one year ago. A gradual moderation in core inflation is helping, but headline inflation is also getting some help from the drop in energy prices versus one year ago, when Russia’s invasion of Ukraine forced a spike in oil prices.
April may be more problematic since energy and gasoline prices have turned higher this month.
The overall slowdown in the CPI is encouraging, but inflation remains a problem. However, according to the U.S. BLS, the Producer Price Index reflects a faster slowdown in inflation at the wholesale level.
Take a moment to review the graphic below. Two data points are provided, the annual change in the core CPI and the 3-month annualized rate for the core CPI.
You’ll notice the 3-month annualized rate is more volatile, as we’re simply taking the change in inflation over 3 months and annualizing it.
It detects changes in the trend sooner, it is more forward-looking, but it is noisier and may provide false signals, which happened during the 2010s.
More recently, the data highlight that the 3-month annualized rate has been far more volatile than the annual change, but we are seeing lower peaks and lower valleys.

Openings remain historically high, though they have been moving lower. This is Fed-friendly because the Fed wants to slow inflation by bringing the demand for labor back in line with the supply of labor.
However, its tools are blunt and can’t be targeted toward specific industries.
While there are plenty of companies begging for workers, there is a mismatch in skills. Openings remain very high for restaurants and other lower-paying service jobs, while tech and other large firms are being much more selective.
Deciphering the data
The recent revisions in job openings also highlight the problems we sometimes see with the data. Distortions in spending created by the pandemic aren’t yet fully understood or incorporated into models.
Data are seasonally adjusted so we can compare weekly, monthly, and quarterly reports as if they are apple-to-apple comparisons.
For example, spending typically jumps in November and December and falls sharply in January. That’s before the data are adjusted for seasonal variations.
However, the pandemic forced a shift in patterns. Holiday spending has spilled into October. That means actual spending doesn’t go up as much in December as it did in the past. So, spending in December fell last year after seasonal adjustments.
Continuing, actual spending doesn’t fall as much in January. Coupled with milder weather in much of the country, spending with seasonal adjustments surged in January per Census data.
What does it mean? As we entered 2023, the economy wasn’t as robust as some of the earlier reports suggested, and recent data are signaling a slowdown, including the labor market.


