



author avatar
Mark Chandik

Oct 31, 2022

Recession Averted

Weekly Market Commentary

The U.S. Bureau of Economic Analyst reported that Q3 Gross Domestic Product (GDP), which is the largest measure of goods and services, expanded at an annualized pace of 2.6%, erasing the declines from Q1 and Q2—recession averted, for now.
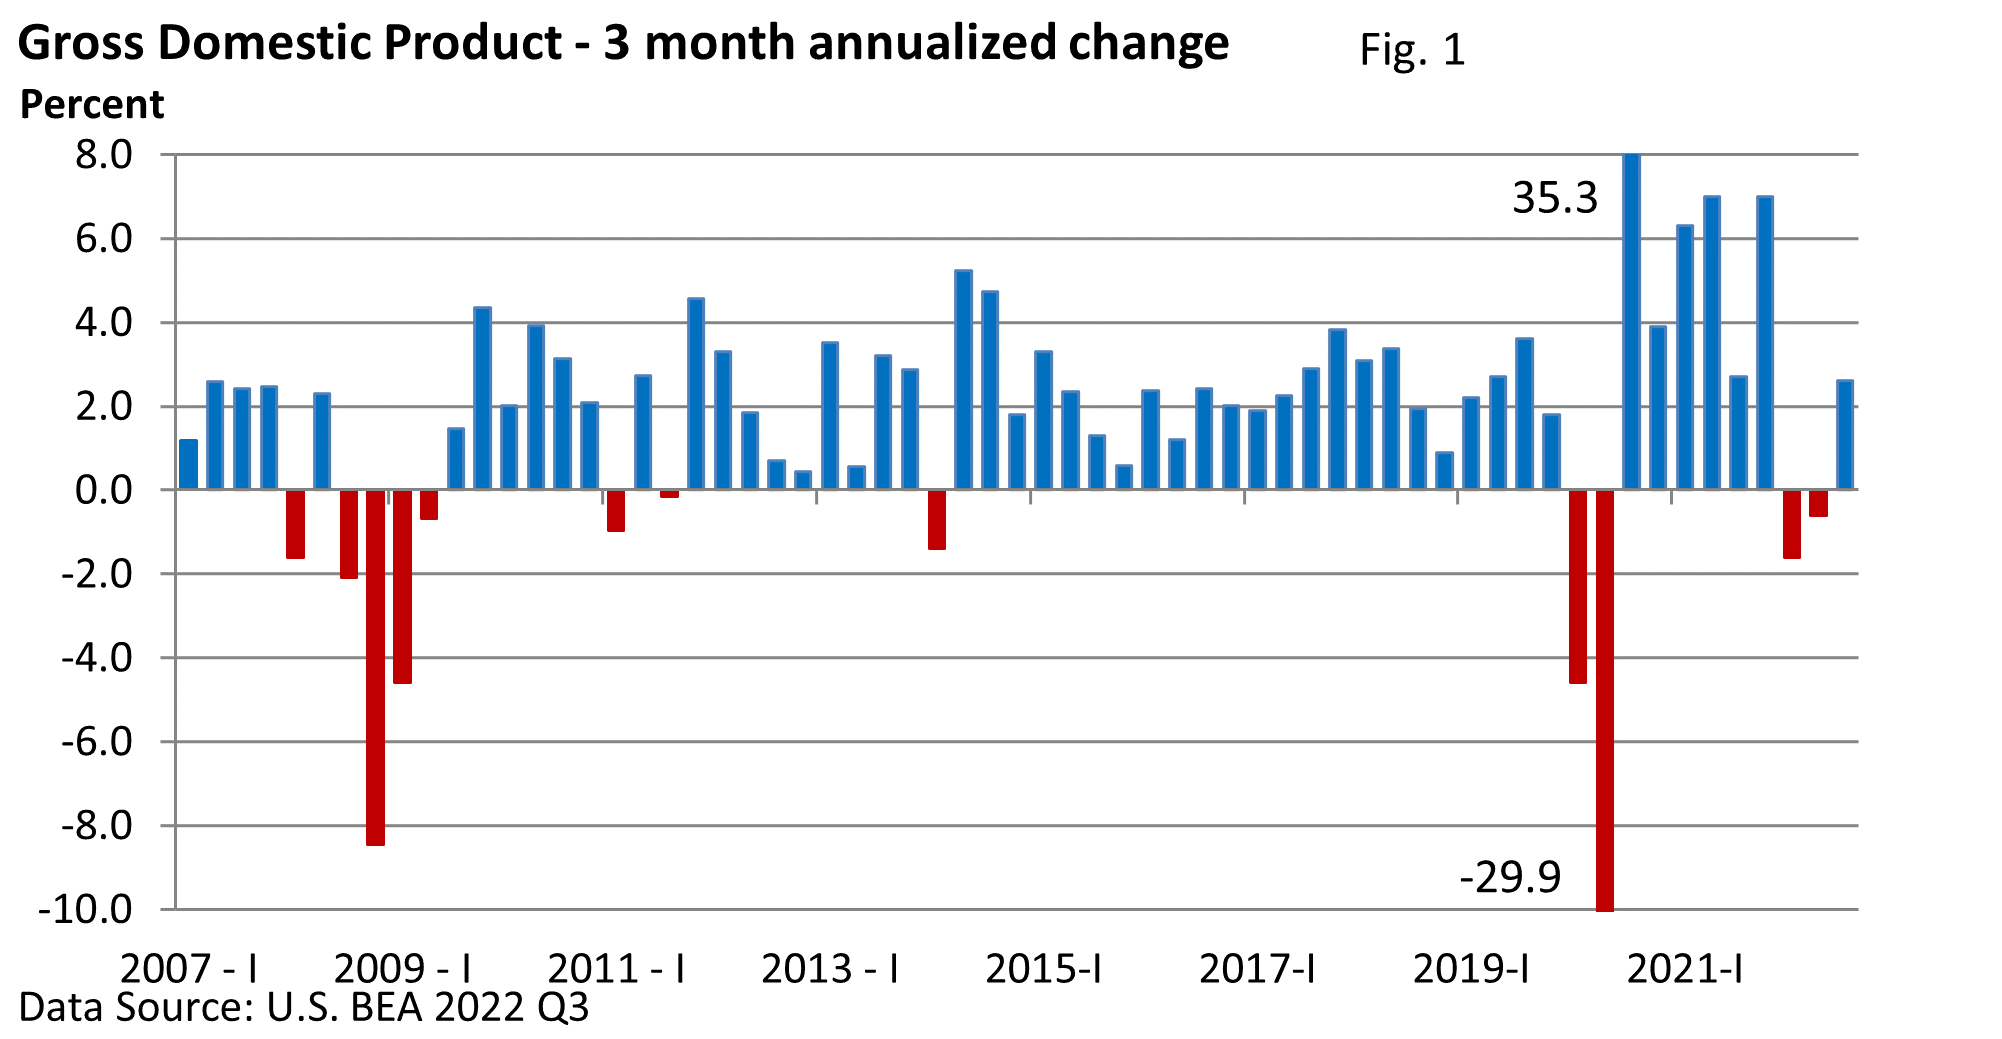
It’s not that the economy is expanding at a robust pace. It’s not. Growth this year has been uneven.

While Q3’s number is cautiously encouraging, GDP is backward-looking. It’s old data. It’s a broad review of the economy’s performance from July through September. We’re entering November.

Moreover, investors attempt to price in events roughly six to nine months in the future.

Last week, we discussed the possibility of a recession. That lends itself to the next question. How do stocks react to recessions?

Historically, interest rates fall, which would be viewed favorably, but that’s just one piece of the stock market pricing equation.

Earnings play a big role, too, and falling demand in the economy pressures corporate profits during a recession.

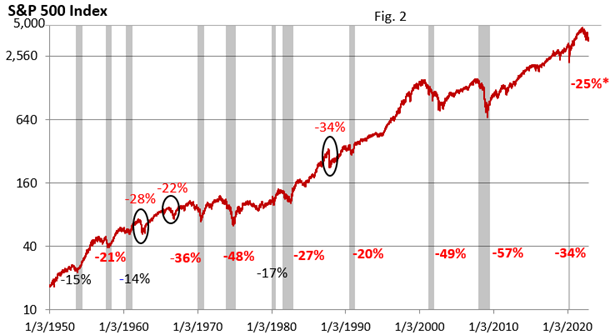
Figure 2 highlights S&P 500 performance since 1950. Since the mid-1960s, bear markets, defined as a selloff of 20% or more, have centered around recessions. The one glaring exception is the 1987 market crash that did not lead to a recession.
How stocks may perform during a recession has varied based on prevailing conditions.

For example, the mild recession in 2001 was accompanied by a ferocious bear market tied to stocks that were extremely overvalued as shares peaked. The decline in 2008 coincided with the financial crisis, which was probably the worst recession since the Great Depression.

But the bear market in 1990 barely met the standard of a bear market.

Since 1950, the average bear market has lopped 34% off the S&P 500 Index (peak to bottom), lasting 13 months on average, with a length of 1 to 31 months.

Bear markets that have shed 30% or less have run for 11 months on average.

Bear markets that have knocked over 30% off the S&P 500 Index have averaged 15 months. But the 15-month figure included the 2020 bear market, which lasted one month, and the 1987 bear market, which lasted 3 months.

Excluding those short-lived declines, the bear markets that exceeded a 30% decline ran 22 months on average.

So far, the current selloff has lasted just over 9 months from its early January peak to the most recent low on October 12.

No one rings a bell when a bear market ends. Attempting to pick the bottom is usually fruitless.

But the historical data provides us with a guide. In addition, bear market recoveries are often front-loaded (Schwab Center for Financial Research).

author avatar
Mark Chandik

Reproduction Prohibited without Express Permission. Copyright FDP Wealth Management. All rights reserved. Advisory Services offered through FDP Wealth Management, LLC, a state Registered Investment Adviser and Valmark Advisers, Inc. a SEC Registered Investment Advisor. Securities offered through ValMark Securities, Inc., Member FINRA/SIPC. 130 Springside Drive, Suite 300, Akron, OH 44333-2431 800.765.5201 Prosperity Partners and FDP Wealth Management, LLC are separate entities from ValMark Securities, Inc. and Valmark Advisers, Inc. Prosperity Partners, FDP Wealth Management, LLC, ValMark Securities, Inc., Valmark Advisers Inc., and their representatives do not offer tax advice. You should consult your tax professional regarding your individual circumstances. Indices are unmanaged and cannot be invested directly in. Past performance is not a guarantee of future results.

Indices are unmanaged and do not incur fees, one cannot directly invest in an index. You should consult your tax professional regarding your individual circumstances. This information is provided by Financial Jumble, LLC. Financial Jumble, LLC is a separate entity from ValMark Securities, Inc. and ValMark Advisers, Inc.

RELATED POSTS

Rising Yields Faily to Derail Stocks

This year, the stock market has risen significantly. Lingering worries about oil prices, inflation, the war with Iran, and the possibility of an AI bubble haven’t subsided. But the economy is expanding, corporate profits have been strong, and the S&P 500 Index set a new high last week, according to the Wall Street Journal.

All Gas, No Brakes: Profits Soar in Q2

In a solid earnings season, we’d generally expect S&P 500 companies to deliver double-digit profit growth, meaning earnings growth of at least 10% versus a year ago (20% tops). That’s not a hard-and-fast rule, but it provides a useful benchmark for evaluating the strength of a quarter.

A Murky Fed Message

“All hat and no cattle” is a traditional cowboy phrase—especially popular in Texas—describing someone who is basically a poser: plenty of talk, lots of sparkle, but little to back it up. It’s all talk and no action, and that’s the takeaway from Federal Reserve Chair Kevin Warsh’s second Fed meeting and subsequent press conference.

Social Security and You

The trust fund that supports Social Security retirement benefits is projected to be depleted in the fourth quarter of 2032. At that point, ongoing revenue from Social Security payroll taxes is expected to cover approximately 78% of scheduled retirement benefits.

Chips in Flux

Since the most recent market low at the end of March, semiconductors (microchips, commonly called chip stocks) have been a very popular trade. In less than three months, the PHLX Semiconductor Index has more than doubled—see Figure 1.