





Weekly Market Commentary
A December 29th Wall Street Journal title summed the year up: What Did Wall Street Get Right About Markets This Year? Not Much.
Back up to December 2022, when Moody’s Chief Economist Mark Zandi captured the most prevalent view at the time.
“Usually, recessions sneak up on us. CEOs never talk about recessions,” Zandi said. “Now it seems CEOs are falling over themselves to say we’re falling into a recession. … Every person on TV says recession. Every economist says recession. I’ve never seen anything like it.”
In the absence of a profit-killing recession, a moderation in Fed rate hikes and a keen interest in artificial intelligence pushed the Dow Jones Industrials to a new all-time high while the S&P 500 Index ended the year just shy of a record. Concerns that temporarily roiled markets in the wake of Silicon Valley Bank’s failure amounted to little more than a hiccup.
Recession MIA
Projecting turning points in any economic cycle is difficult, and it’s not unusual for economists to miss their targets.
Economic models are complex, and each cycle has its own unique characteristics. Only in hindsight do we usually identify them. Without the foresight to recognize the emergence of new economic influences, economic forecasting models can provide false signals.
The Fed shifts its stance
The economic story of 2022 was high inflation and sharply higher interest rates. Both punished stocks. Last year, the rate of inflation began to slow, and the Fed adjusted its response, raising rates by a total of one percentage point compared to 4.25 percentage points in 2022 – Figure 1.
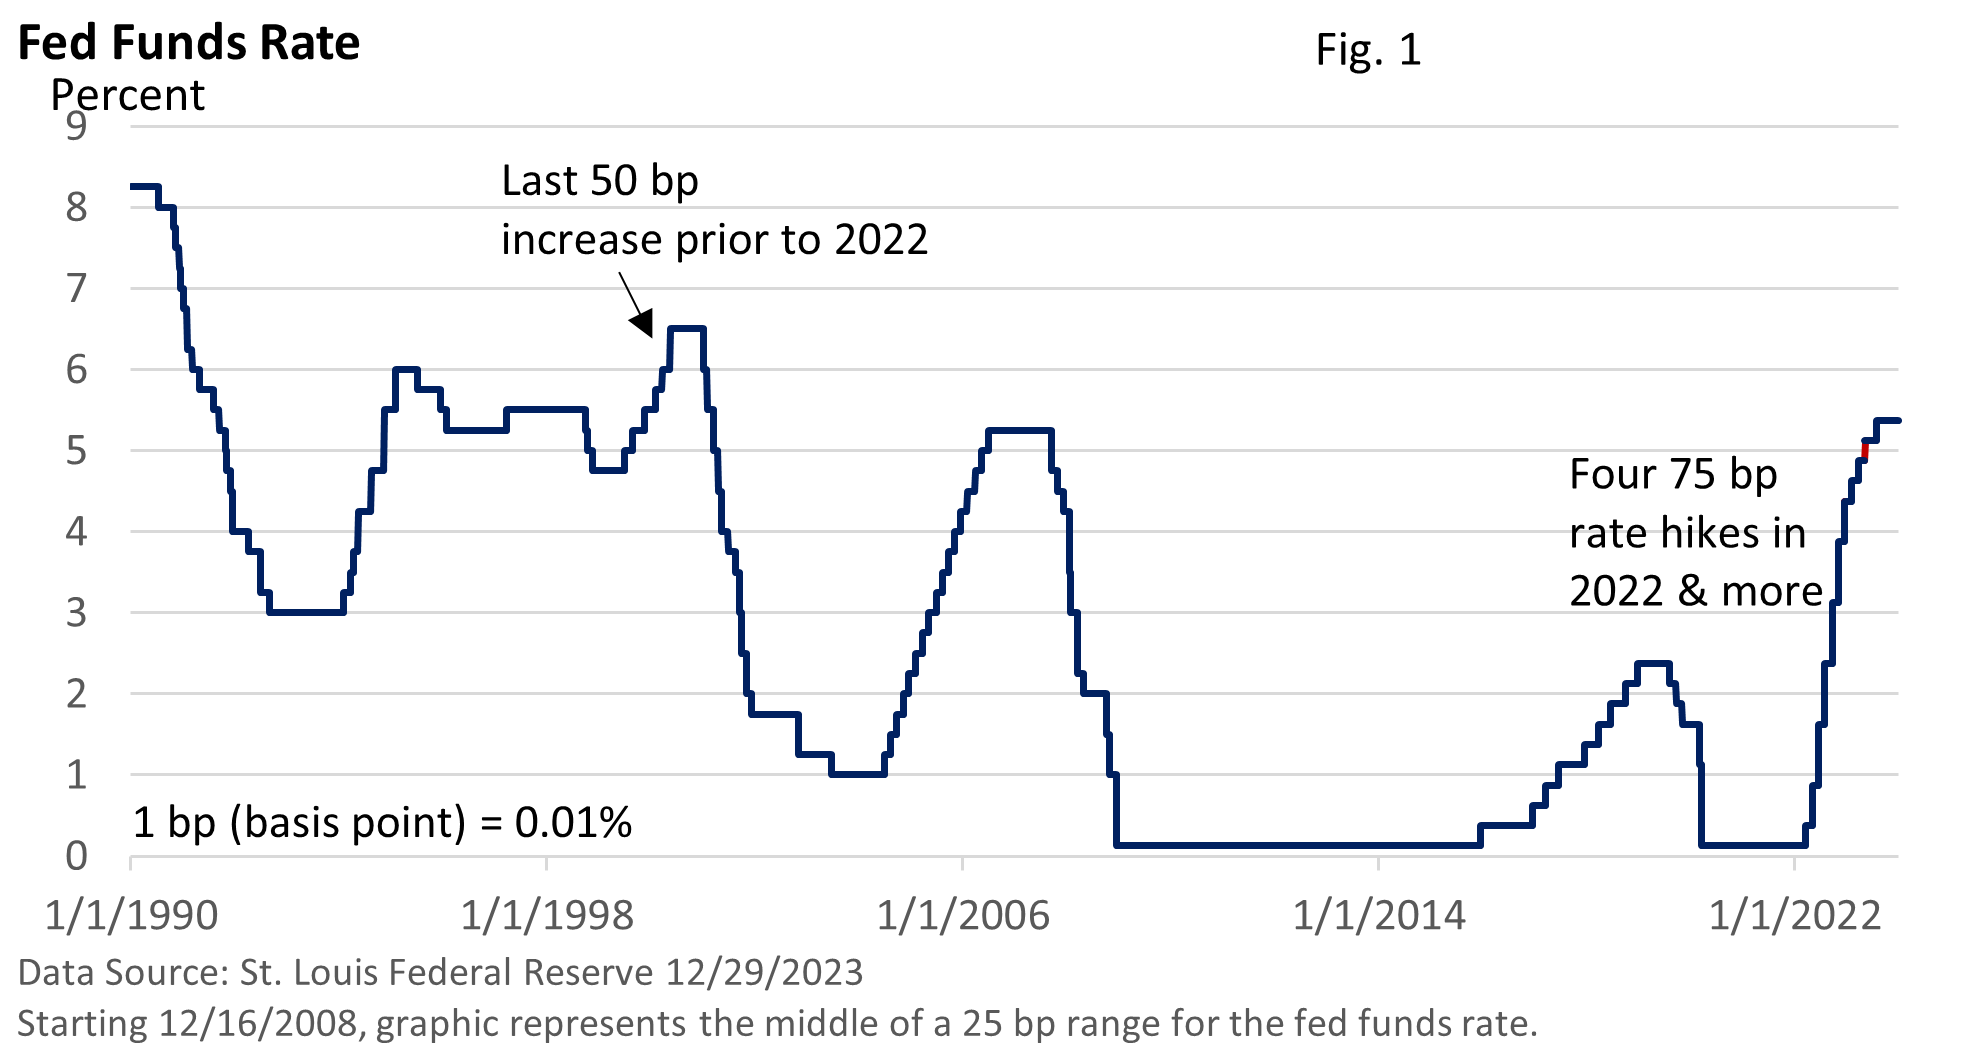
Rate hikes are probably over. While forecasts can change, the Fed projected a total of 75 bp in rate cuts this year when it released its quarterly Economic Projections in December.
The Magnificent Seven
Not all rallies are created equal.
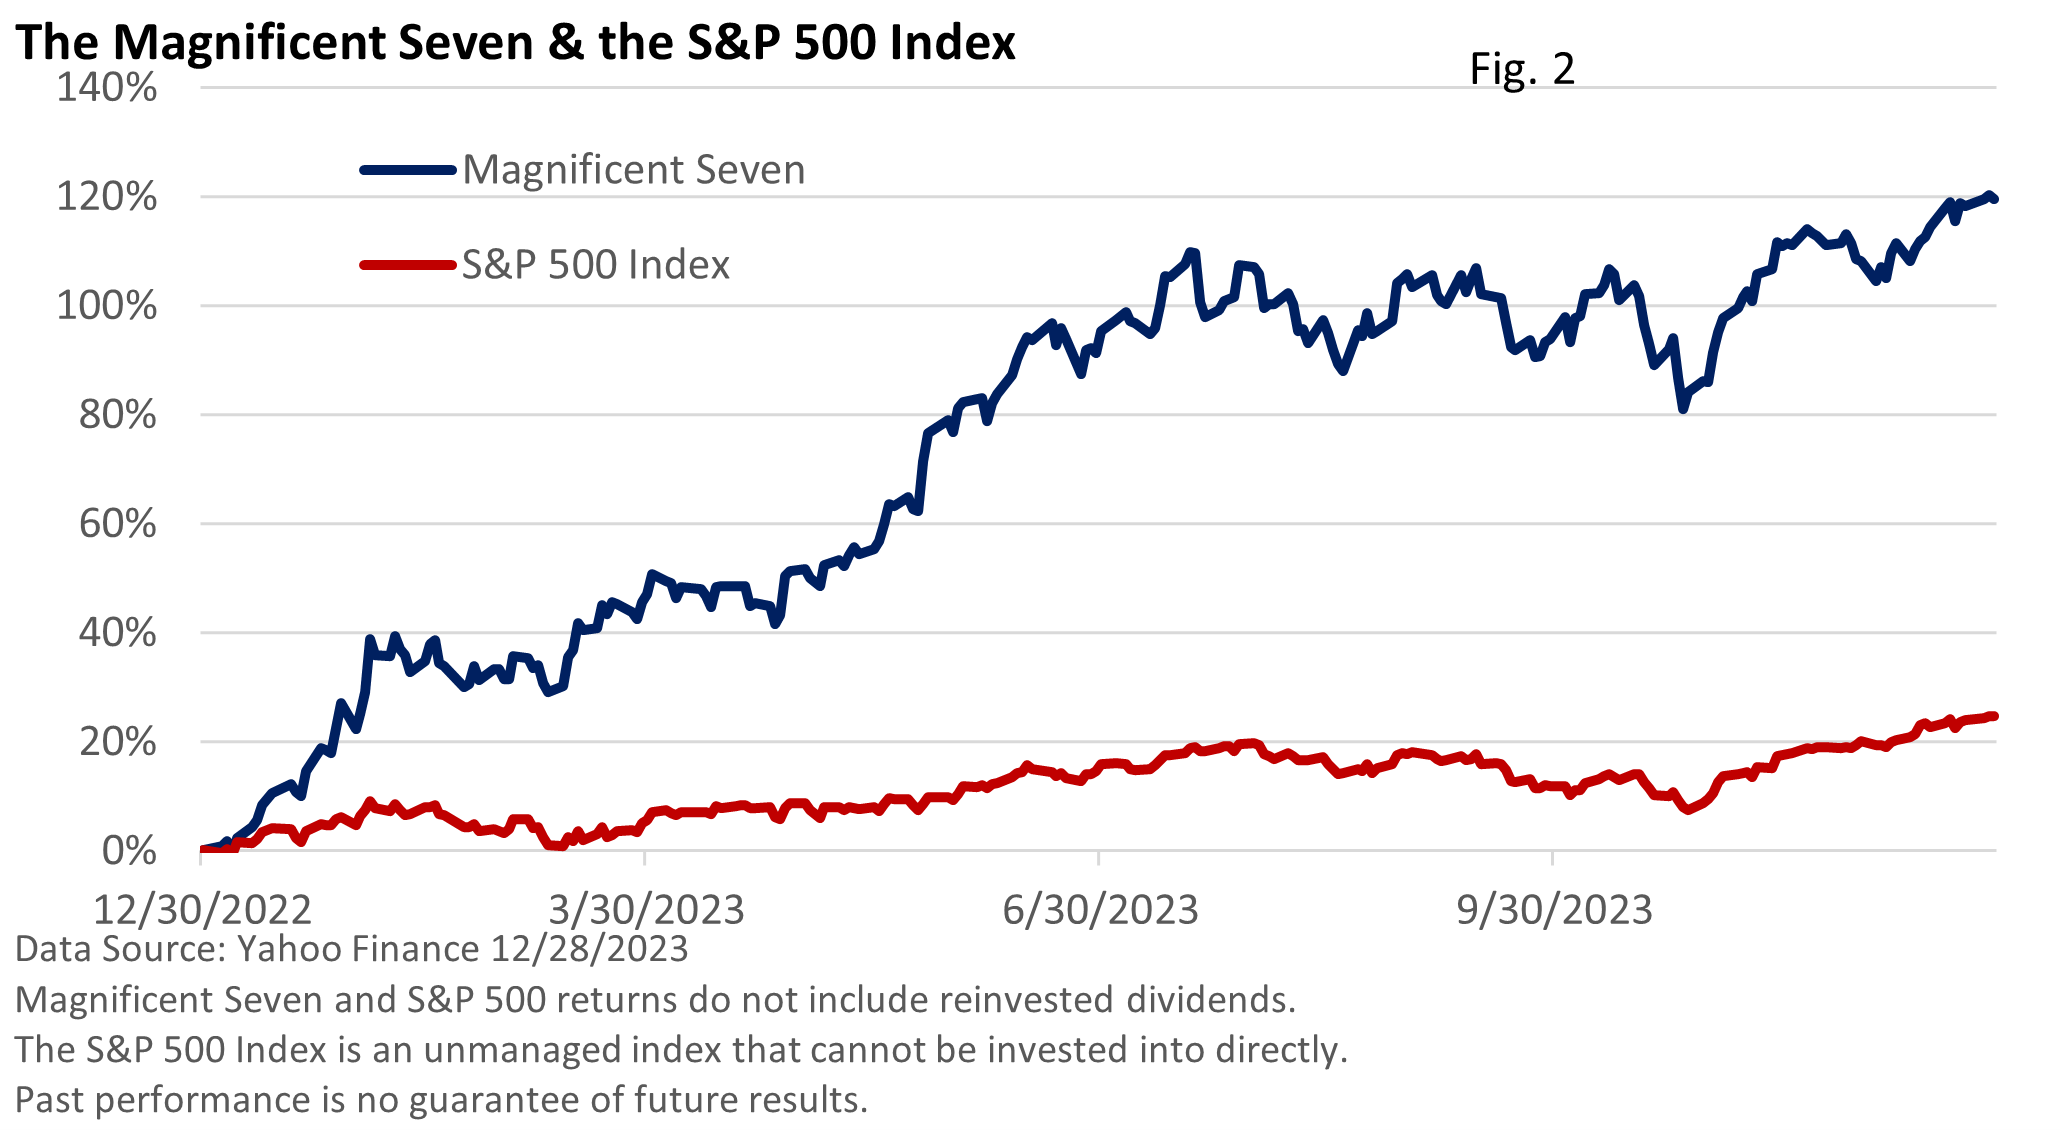
Coined the “Magnificent Seven” by a Bank of America analyst, Microsoft (MSFT), Amazon (AMZN), Meta Platforms (META, formerly Facebook), Apple (AAPL), Alphabet (GOOG, formerly Google), Nvidia (NVDA), and Tesla (TSLA) significantly outperformed as Figure 2 illustrates.
Collectively, they account for about 30% of the performance of the S&P 500 Index, according to the Wall Street Journal (as of December 17, 2023). Excluding those seven stocks, the S&P 500’s advance would have been roughly half, according to the Wall Street Journal.
Yields turn the wheels
Figure 3 demonstrates that over the past five months, bond yields have played a crucial role in driving the stock market. As yields increased from August into late October, the S&P 500 Index pulled back about 10%. Following the peak in yields, the market rallied.
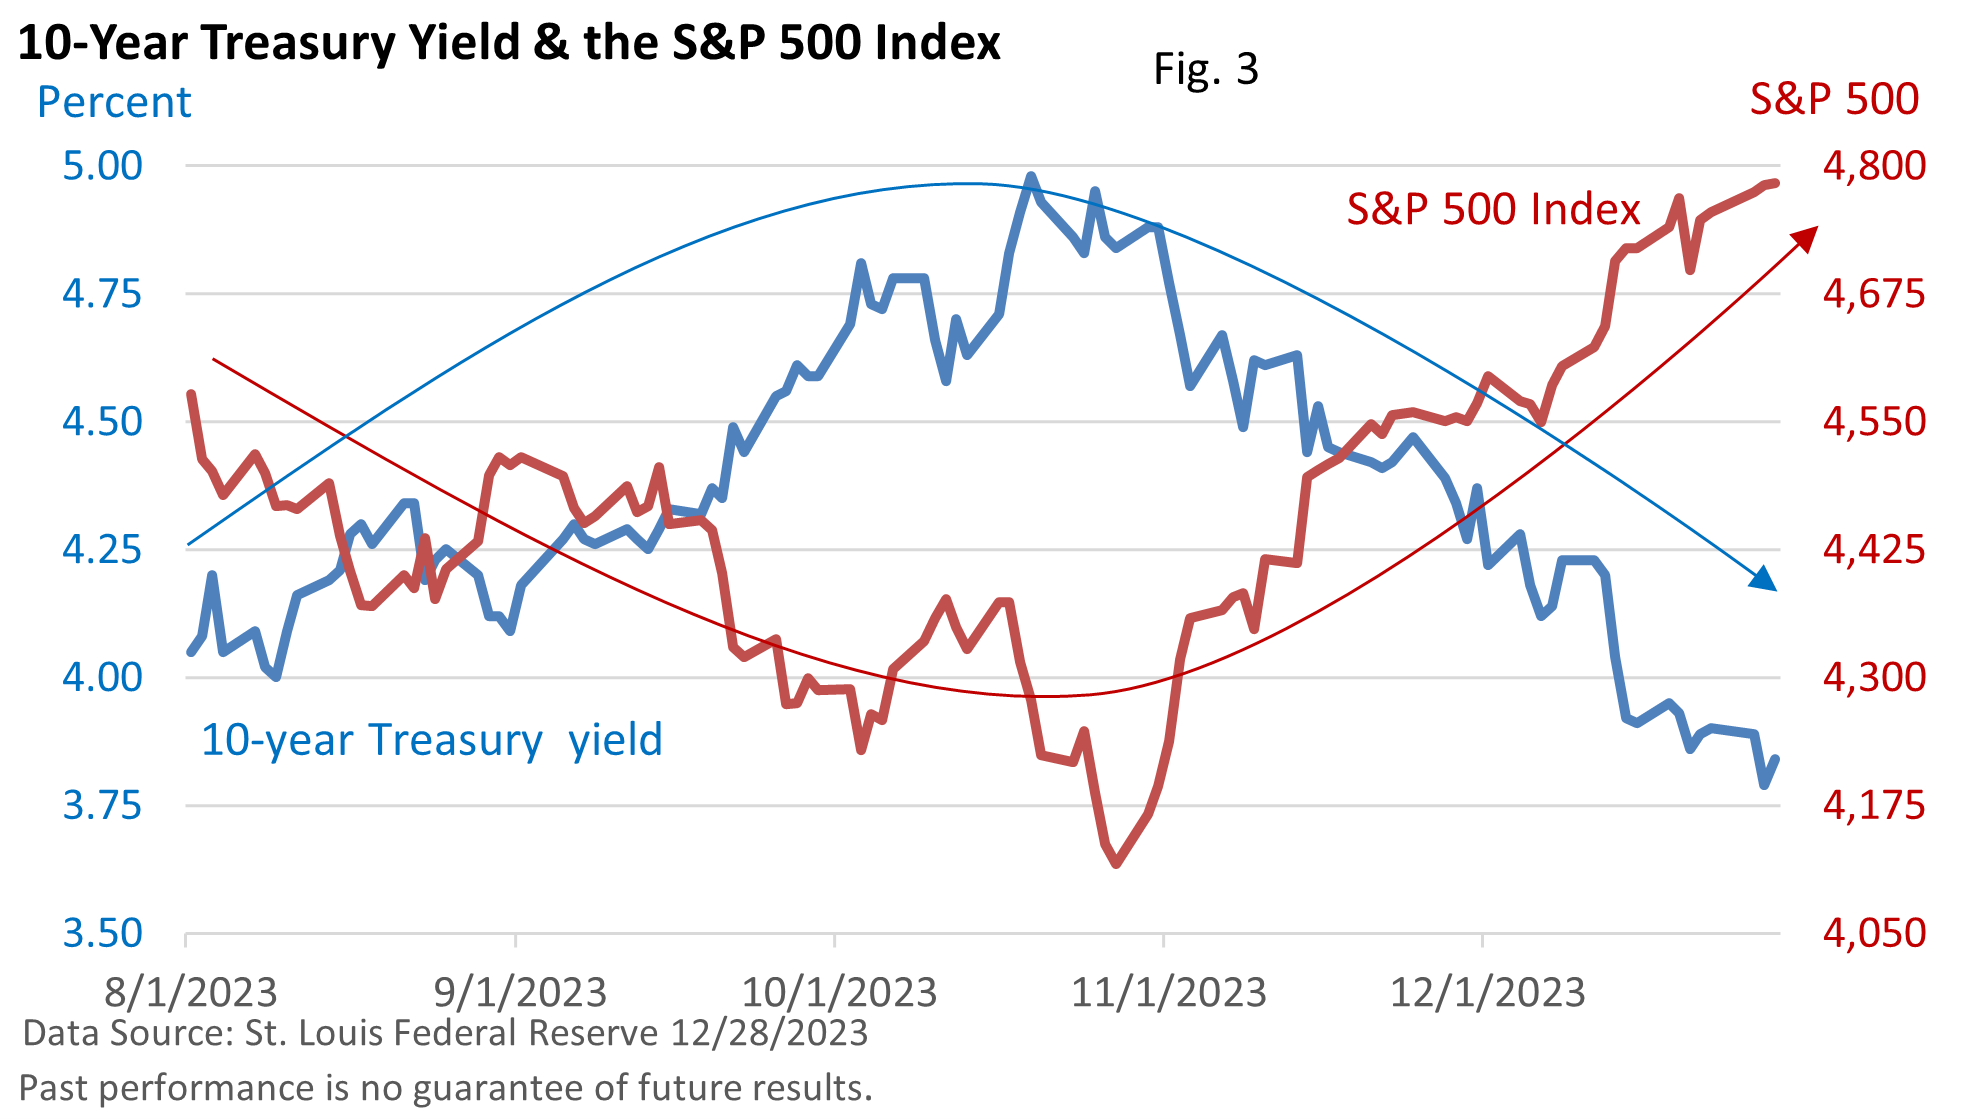
Over time, however, these correlations usually break down.
Treasuries are sometimes viewed as a safe haven in times of economic uncertainty. Treasury bond prices and yields move in the opposite direction, so falling yields simply mean bond prices are rising.
If yields decline too quickly, investors may start to fret over a potential economic slowdown, creating headwinds for stocks.
The preferred scenario for investors is one where economic growth is slow enough to keep inflation in check, but not so slow as to noticeably hamper corporate profit growth.
This would likely allow the Fed to slowly reduce rates because it “can,” not because the economy slips into a recession and it “must.”
A New Year
We have access to the brightest minds on Wall Street. But is it always wise to seek their counsel?
At the end of 2022, many strategists were pessimistic about the upcoming year of 2023. Analysts, on average, were predicting a small decline of about 2% in the S&P 500 Index, according to Bloomberg.
2023 wasn’t the first time the consensus was wrong nor was it a rare miss. The median annual Wall Street forecast between 2000 – 2020 missed the mark by an average of 12.9 percentage points (CNBC/NY Times).
Notably, last year was the first time that analysts predicted a market decline during the 2000s.
Over the long term, stocks have a solid track record, but progress is uneven. Downturns are to be expected. According to data from Macrotrends, the S&P 500 Index (excluding reinvested dividends) has finished lower seven times since 1999.
Market weakness was predicated on a 2023 recession that failed to materialize.
However, let’s not completely discount commentary. Strategists bring unique observations to our attention. We are better informed due to their diligence and insights.
They really are brilliant men and women. But they grapple with the unknown, and no one knows precisely how the future will unfold.
Yet, the unknown encourages us to get comfortable with some degree of risk. It allows us to become better and more disciplined investors.
Figure 4 highlights that stocks have a long-term upward trend, and long-term investment plans are customized to participate in that trend, but pullbacks are common.
Last year, the S&P 500 posted a return of 26% (blue bar, including reinvested dividends). During the period, the maximum pullback was 10% (red dot) – Figure 4.
Since 1980, the S&P 500 Index finished higher 82% of the time. When the index ended the year in positive territory, the average gain was 19%. When the index finished lower, the average loss was 13%.

As we bid farewell to 2023, may the New Year bring you excitement, adventure, and fulfillment. May the year create cherished memories and be filled with joy. Happy New Year!
