Feb 12, 2024

There is an Election This Year

Weekly Market Commentary

Last week, we examined the relationship between interest rates and stocks. This week, we will analyze market performance during presidential election years.

So, what might we expect based on historical returns during a presidential election year?

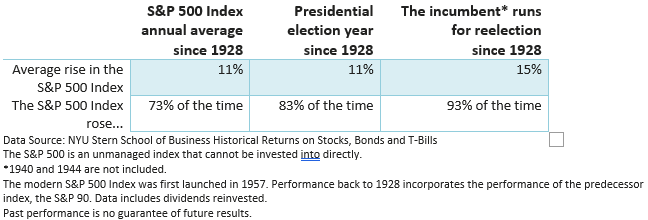
Since 1928, the S&P 500 Index averaged an annual increase of 11% (dividends were reinvested). The index finished the year higher 73% of the time, according to data provided by the NYU School of Business.
Let’s turn to the years in which a presidential election was held.

During a presidential election year, the S&P 500 averaged an advance of 11%, in line with historical norms. The S&P 500 rose 83% of the time during a presidential election year, topping the long-term average of 73%.

When the incumbent ran for reelection, performance improved. The S&P 500 averaged an increase of 15% during the 14 periods surveyed. The S&P 500 Index finished the year higher 93% of the time (1932 was the exception when Herbert Hoover sought a second term during the Great Depression).

The returns include 1948, 1964, and 1976, when the respective vice presidents had assumed the presidency and ran for reelection. Returns do not include 1940 and 1944, when FDR ran for a third and fourth term.

Bottom line

Perhaps presidents seeking reelection implement policies that benefit stocks and the economy as they seek a second term. The economy is usually the top issue for investors, not politics.

Whatever may account for the upbeat performance when an incumbent hits the campaign trail, let’s not forget that investors typically respond to the economic fundamentals not politics.

Reproduction Prohibited without Express Permission. Copyright FDP Wealth Management. All rights reserved. Advisory Services offered through FDP Wealth Management, LLC, a state Registered Investment Advisor. Securities offered through Valmark Securities, Inc., Member FINRA/SIPC | 130 Springside Drive Suite 300 Akron, OH 44333-2431 | 800.765.5201. FDP Wealth Management, LLC is a separate entity from Valmark Securities, Inc. If you do not want to receive further editions of this weekly newsletter, please contact me at (949) 855-4337 or e-mail me at info@fdpwm.com or write me at 8841 Research Drive, Suite 100, Irvine, CA 92618. FDP Wealth Management, LLC, Valmark Securities, Inc. and their representatives do not offer tax or legal advice. You should consult your tax or legal professional regarding your individual circumstances. Indices are unmanaged and cannot be invested directly in. Past performance is not a guarantee of future results.

RELATED POSTS

Sticky Inflation

The U.S. Bureau of Economic Analysis (BEA) reported that Gross Domestic Product (GDP) expanded at an annual pace of 2.8% in Q3, which was down from 3.0% in Q2.

Job Growth and Economic Growth

The U.S. Bureau of Economic Analysis (BEA) reported that Gross Domestic Product (GDP) expanded at an annual pace of 2.8% in Q3, which was down from 3.0% in Q2.

Another Strong Earnings Season

The U.S. Bureau of Economic Analysis (BEA) reported that Gross Domestic Product (GDP) expanded at an annual pace of 2.8% in Q3, which was down from 3.0% in Q2.

Does a Republican Sweep Matter for Investors?

The U.S. Bureau of Economic Analysis (BEA) reported that Gross Domestic Product (GDP) expanded at an annual pace of 2.8% in Q3, which was down from 3.0% in Q2.

Inflation—Not Back to Target, Not Enough to Derail a December Rate Cut

The U.S. Bureau of Economic Analysis (BEA) reported that Gross Domestic Product (GDP) expanded at an annual pace of 2.8% in Q3, which was down from 3.0% in Q2.