Weekly Market Commentary
The U.S. Bureau of Labor Statistics reported that nonfarm payrolls in May rose 272,000, easily beating expectations of 190,000 per the Wall Street Journal. Over the past three years, nonfarm payrolls have usually topped expectations. That narrative remains intact.
Meanwhile, the unemployment rate rose from 3.9% in April to 4.0% in May. It’s the first time the unemployment rate has been at 4% since January 2022.
And that typically raises a question. If employment growth is strong, why is the unemployment rate gradually ticking higher?
Cutting through all the jargon, the answer is pretty straightforward. Nonfarm payrolls are taken from what’s called the Establishment Survey (of businesses), while a separate survey called the Household Survey (of households) provides the unemployment rate.
Put another way, two surveys can sometimes yield different results.

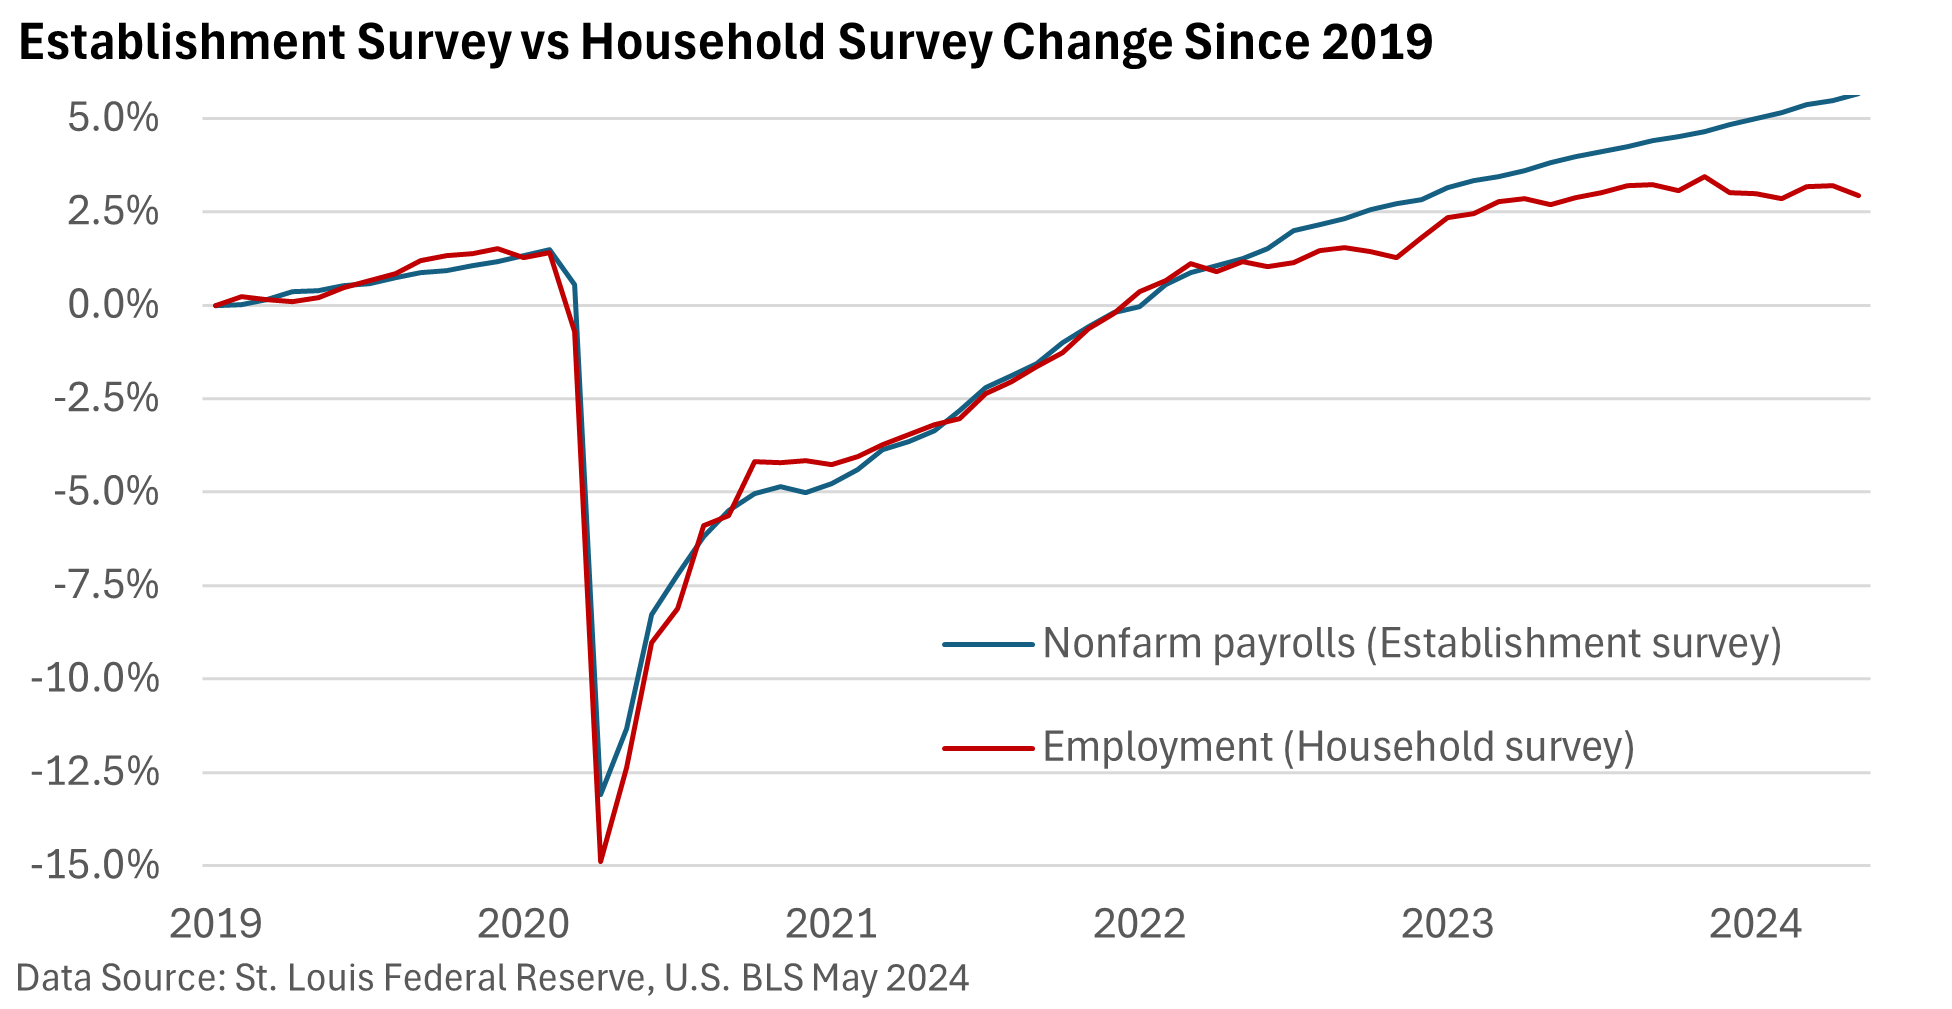
While monthly employment discrepancies in the surveys are not uncommon, they typically wash out over several months. Not today, however, as the graphic above illustrates.
Note the employment component in both surveys. Nonfarm payrolls are on an upward trajectory, while employment in the Household Survey has lagged. Economists favor the Establishment Survey regarding actual job growth.
And here’s where a possible explanation gets a bit wonky.
To calculate the employment number in the Household Survey, the U.S. BLS calculates the share of the population that is working and then applies it to population estimates from the Census Bureau, according to the Wall Street Journal.
This might be the source of the discrepancy: the population estimate might be off thanks to immigration.
The U.S. Census estimates the U.S. population rose 0.5% in 2023. However, in January, the Congressional Budget Office (CBO) estimated that the population increased by 0.9%. The CBO’s estimate attempts to account for migrants entering the country.
Increased migration would also help account for the rise in the jobless rate as more individuals seek work.
If only it were that simple.
A report called the Quarterly Census of Employment and Wages (QCEW) seems to be signaling that the nonfarm payroll growth might be overstated, though not as weak as the employment number in the Household Survey.
Per Bloomberg, the QCEW data are taken from unemployment insurance tax records filed by more than 12 million establishments vs 120,000 businesses surveyed in the Establishment Survey.
If the QCEW data are correct, nonfarm payrolls were overstated by about 60,000 per month in 2023. The average increase in nonfarm payrolls last year was 251,000, per the U.S. BLS. Subtract 60,000, and a rise of 191,000 is still healthy.
Confused? You’re not alone. So are various economists.
The current economic cycle has its own unique characteristics, especially considering the post-pandemic environment and the potential impact of immigration on data interpretation.
Bottom line—there are pockets of trouble depending on the profession, and job openings are declining, according to U.S. BLS data.
Nonfarm payroll data may be overstating the actual numbers, but the economy is generating new jobs.


