





Market pullbacks are to be expected. They are incorporated into the financial plan. But like an unexpected traffic jam, they are exceedingly difficult to predict.
Early August was one such event. The turbulence began at the end of July in the wake of seemingly minor news—the U.S. BLS reported another rise in the unemployment rate, which forced some investors to re-evaluate their view of a recession.
On top of that, the Bank of Japan had just raised interest rates. On Monday, August 5, we saw a significant unwinding of leveraged currency and stock trades in Japan, which spread globally.
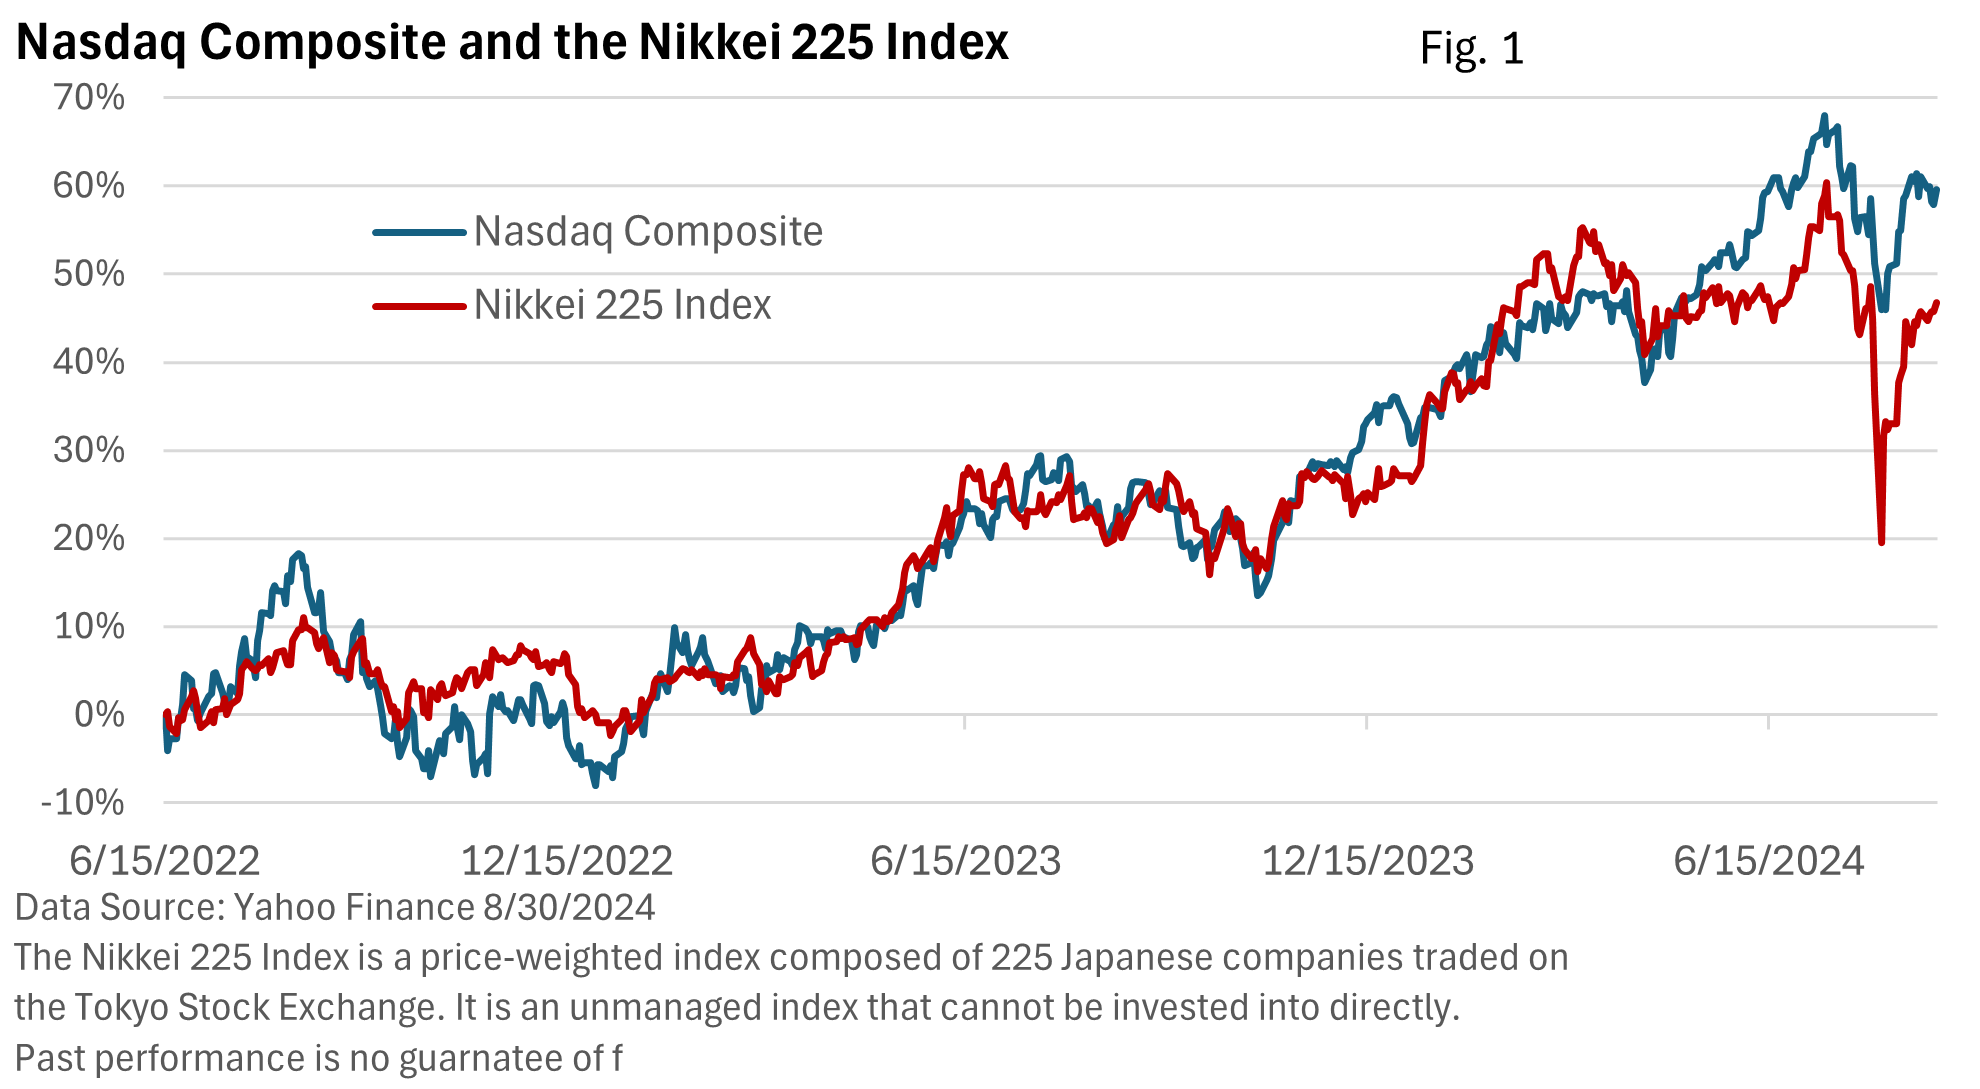
Why might this matter to U.S. investors? Reuters reported that a well-known gauge of Japanese stocks cratered 12% that day (Figure 1). It was the worst one-day selloff since 1987.
To put that in perspective, the Dow fell nearly 13% on Black Monday, October 28, 1929, and nearly 12% the next day, according to Federal Reserve History. On October 19, 1987, the Dow plunged almost 23%. Like the 1929 Crash, it is also known as Black Monday.
What happened in Japan quickly rolled across the globe. At the close on Monday the 5th, the S&P 500 Index hit a near-term bottom, shedding 6.1% in three days of trading, according to S&P 500 data from the St. Louis Federal Reserve.
Figure 1 offers a fascinating view of where some of those leveraged bets (at rock-bottom Japanese rates) were invested. Over the past two years, the two indexes have had a strong correlation. Such relationships eventually break down.
From its peak on July 16, the S&P 500 Index gave up 8.5% through August 5.
According to LPL Research, the S&P 500 averages at least a 10% correction every 12 months. The last such 10% pullback occurred almost a year ago. Of course, these are just averages, and they can vary from year to year.
What happened in the three weeks between July 16 and August 5 is far from unusual. A calendar year in which the S&P 500’s maximum peak-to-trough decline fails to exceed 8%, well, that might be considered unusual.
In reality, it was a garden-variety pullback, and U.S. markets proved to be quite resilient.
Cooler heads prevailed, as JPMorgan estimated that 75% of these leveraged positions had been unwound by week’s end. Moreover, relatively upbeat economic data in the U.S. alleviated short-term recession fears, and stocks lurched higher, including multiple record highs for the Dow on August 26, August 27, August 29, and August 30, per MarketWatch.
The Fed Steps In
The inflation rate is still too high, but it is slowing down. Moreover, the labor market is no longer red-hot. Jobs are not as plentiful, and job growth is moderating. Therefore, the Fed sent an unmistakable signal that it intends to reduce interest rates, very likely in September.
“The time has come for (monetary) policy to adjust. The direction of travel is clear, and the timing and pace of rate cuts will depend on incoming data, the evolving outlook, and the balance of risks,” Fed Chief Powell said in prepared remarks in late August.
By ‘policy,’ he meant interest rates, and by ‘direction of travel,’ he meant lower. How quickly rates might fall will depend mainly on the incoming economic data.
The Fed hasn’t raised the fed funds rate since July 2023. It’s been over a year, but that doesn’t mean policy hasn’t implicitly become tighter when measured against inflation.
Figure 2 simply takes the midpoint of the fed funds rate (quarter-point range) and subtracts the annual change in the core Consumer Price Index (the CPI less food and energy).
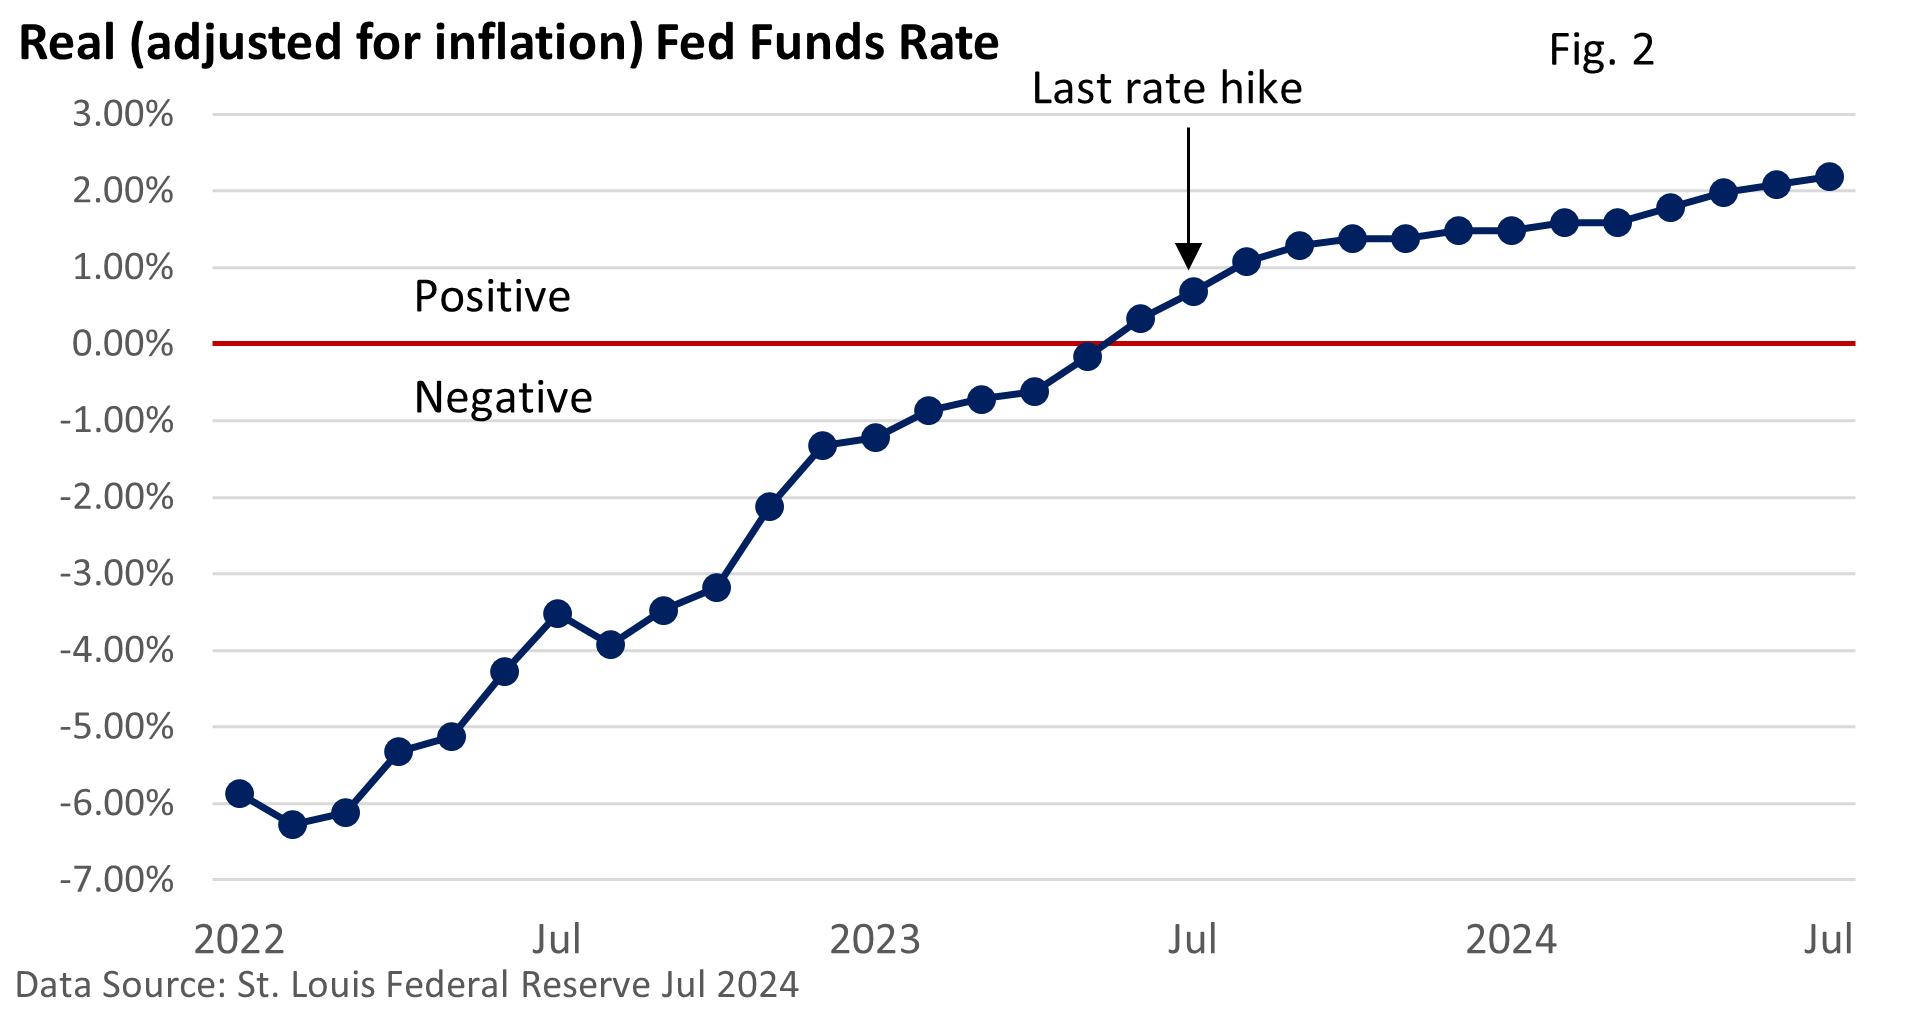
The real fed funds rate has more than doubled since the last rate hike by the Fed.
As job growth cools and inflation has slowed, many analysts and Fed officials believe it’s time to reduce the fed funds rate.
What might this mean for investors?
Well, much may depend on how the economic outlook evolves. Historically, the S&P 500 has performed well when rates gradually decline, and a recession is avoided.
Price returns (%), excluding dividends, for the S&P 500 Index following the first rate cut
| 1984 | 1989 | 1995 | 1998 | 2001 | 2007 | 2019 | |
| 1-month after cut | 0.60 | -0.83 | 0.89 | 3.52 | 0.14 | 1.34 | -1.81 |
| 3-months after cut | 9.02 | 7.71 | 5.14 | 18.38 | -17.89 | -4.26 | 1.92 |
| 6-months after cut | 14.61 | 7.50 | 11.32 | 24.89 | -8.39 | -12.44 | 8.23 |
| 12-months after cut | 22.49 | 12.56 | 18.67 | 20.91 | -13.53 | -20.61 | 9.67 |
Data Source: FactSet, CNBC Pro, St. Louis Federal Reserve
Past performance is no guarantee of future results.
When did the market outlook sour? In 2001 and 2007, the economy slid into a profit-killing recession soon after the Fed began to ease, and rate cuts did little to support equities.
Final Thoughts
According to the Stock Trader’s Almanac, September is the worst month of the year for the Dow, the S&P 500, and the Nasdaq Composite.
Yet, this isn’t a hard and fast rule. It’s simply a long-term average for September’s performance. August is also historically weak, and the Dow set multiple records last month.
A recent remark by Liz Ann Sonders, Chief Investment Strategist for Charles Schwab, encapsulates much of our philosophy.
“One of the beliefs I (Liz Ann) share with Chuck (Schwab) is the inability to time markets with any precision. Too many investors believe the key to success is knowing what’s going to happen in the market and then positioning accordingly. But the reality is that it’s not what we know that makes us successful investors; it’s what we do.
“In his memoir, Invested, Chuck wrote: ‘If I had learned anything after years in the business, it was how little I could ever know about what the market would do tomorrow.’”
