





What’s driving the recent rise in Treasury yields (bond prices and yields move inversely), and why does it matter for investors?
- Oil prices above $100 have raised inflation concerns among bondholders.
- Recent economic reports point to a hotter-than-expected economy, and bond yields would be expected to rise as stronger demand for goods and services lifts the cost of money.
- We could also point to the rising US federal deficit, which raises the supply of bonds in the market, and a gradual shift of foreign buyers away from Treasury bonds.
Figure 1 plots yields at various maturities on a specific date—what is called the yield curve. February 27 marks the 2026 low for the yield on the 10-year bond. Since then, Figure 1 illustrates the dramatic rise in yields.
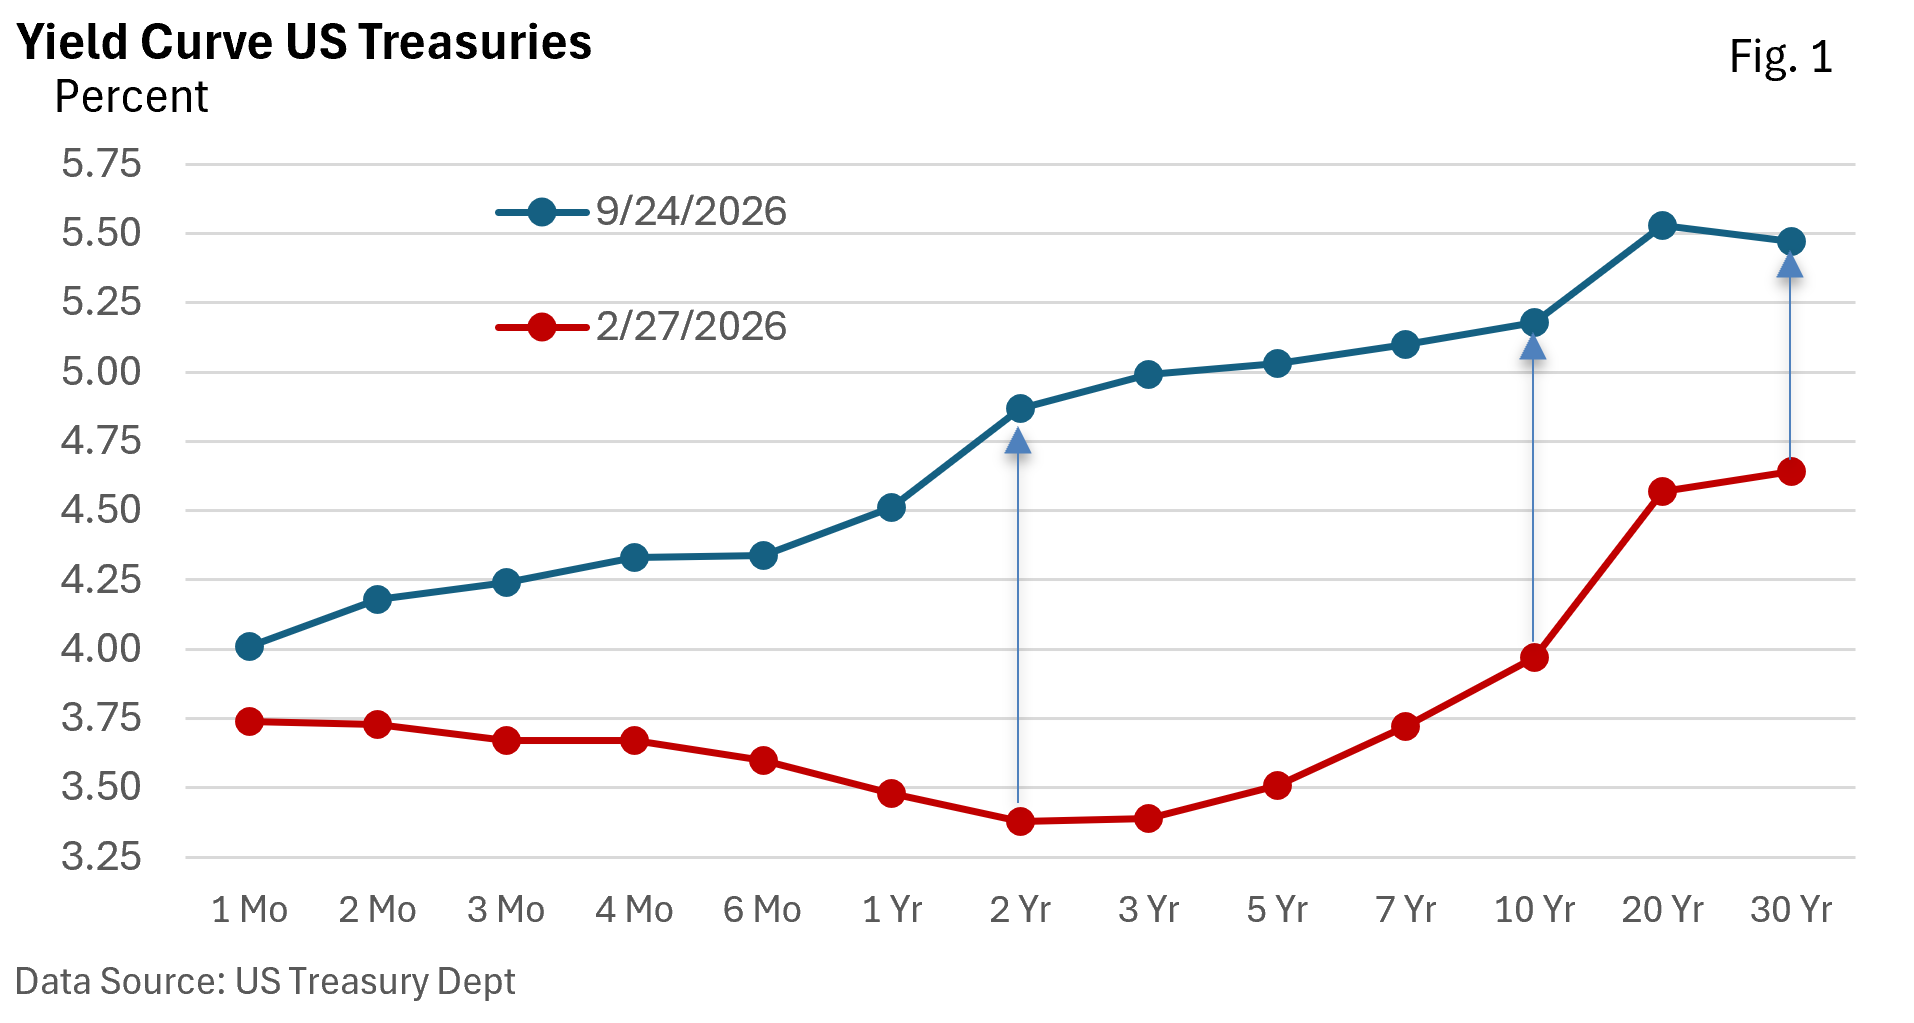
Recently, however, yields of various longer-term maturities have crossed the 5% threshold.
So what does history tell us about the stock market’s reaction to changing bond yields?
Through 1997, a higher 10-year Treasury bond yield didn’t prevent stocks from rising but tended to mute gains. Notably, that paradigm shifted in the late 1990s: falling yields were associated with a slight decline in the S&P 500, while rising yields were positive for stocks.
Table 2: Interest Rates and S&P 500 Performance—monthly change
| Apr 1953 – Dec 1997 | Jan 1998 – Dec 2019 | |
| 10-Year Yield Down | 2.15% | -0.18% |
| 10-Year Yield Up | 0.30% | 1.26% |
Source: S&P Dow Jones Indices, St. Louis Federal Reserve
The table is for illustrative purposes only. Specific months can deviate substantially from averages.
Past performance is no guarantee of future results.
Yields, particularly during the 2010s, were much lower than they are today. As a result, rising yields were often seen as a sign of a strengthening economy and improving corporate profit growth, both of which generally support stocks.
Moreover, because yields started from such low levels, increases typically posed less of a threat to equity valuations. Yields were simply moving from very low to merely low. In that environment, money flowing out of bonds was often interpreted as a “risk-on” signal (yields up, stocks up), while money flowing into bonds was viewed as a “risk-off” signal (yields down, stocks down).
But a shift occurred in the 2020s, as Table 3 shows: the monthly change in the 10-year yield versus the monthly change in the S&P 500 Index.
On average, the biggest rise in yields negatively affected stocks, while the biggest decrease in yields provided a strong tailwind for equities, as measured by the S&P 500 Index.
On average, stocks performed well when yields rose moderately (the second quartile in Table 3).
Table 3: A return to the pre-2000s regime: 2021—2026
| Change in yields in quartiles | Avg Monthly Change in 10-Year Treasury (bps) | Avg Monthly S&P 500 return (%) |
| Biggest Rise in Yields | +40 | -1.56 |
| Moderate Rise | +14 | +1.29 |
| Moderate Decrease | -4 | +1.50 |
| Biggest Decrease | -28 | +3.38 |
Source: St. Louis Federal Reserve; Data from Jan 2021—Aug 2026
The table is for illustrative purposes only. Specific months can deviate substantially from averages.
bps = basis points, 1 bp = 0.01%
Past performance is no guarantee of future results.
Rising yields may eventually ‘break something’ in the financial system. We saw that when Silicon Valley Bank collapsed in 2023.
Yet, while we recognize that periods of market volatility are not uncommon, history shows that stocks, as measured by the S&P 500 Index, have generally delivered positive returns over longer time horizons, even with modest increases in rates.
For much of the year, stocks have ground higher, despite rising Treasury bond yields, on strong profit growth.
Friday’s S&P 500 close of 7,743.41 was just 0.7% below the August 13 closing high.
