





author avatar
Mark Chandik

Sep 3, 2024

Then and Now

Overbuilding, speculation, and easy access to credit encouraged a housing boom and a bust in the 2000s. Sales cratered later in the decade, and along with it, prices tumbled.

Today, housing sales have plummeted once again. According to the National Association of Realtors (NAR), sales of existing homes, which account for about 85% of all housing sales (NAR and Census Bureau data), are languishing near 2008 levels.

Existing home sales are down about 38% from early 2022, according to the NAR.

Yet, prices just hit a record high, per the S&P CoreLogic Case-Shiller 20-City Home Price Index. It’s counterintuitive.

The sharp drop in sales would be expected to create a buyers’ market and lower prices, as would-be sellers are forced to slash prices amid a glut of homes for sale. But that hasn’t happened.

Let’s review some of today’s key differences that have kept prices elevated and pushed the index to an all-time high in June (the latest report that is available).
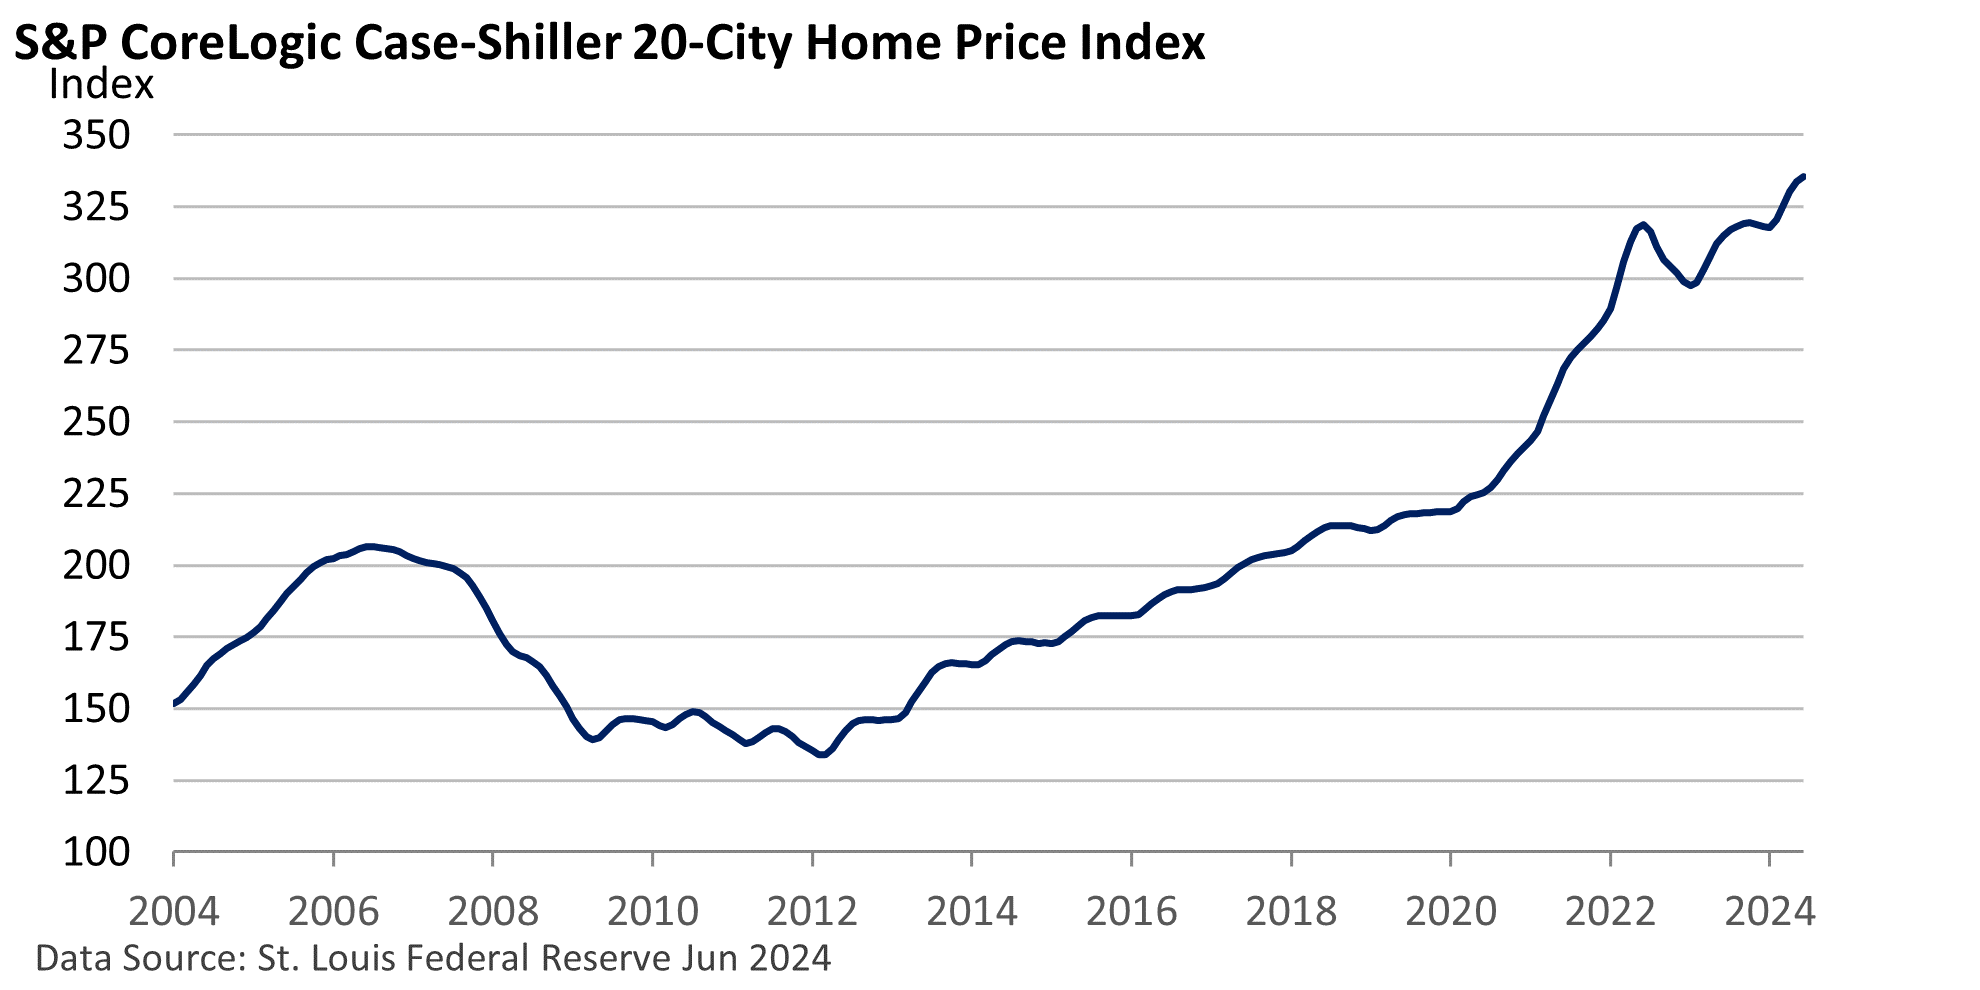
But first, let’s acknowledge that prices vary by location, city, and zip code. While prices are up overall, some locales are seeing declines. But not to the extent of what was happening in 2008, when some underwater homeowners simply walked away from their houses, adding supply to an already glutted market.

Lending standards are much better today. Many buy with significant equity and aren’t willing to hand their keys to the bank if prices dip modestly. More importantly, homeowners who would like to sell are trapped by what might be called “the golden handcuffs.”

Many refinanced around 3% a few years ago. Today, rates are much higher, and those who would like to move are unwilling to trade in their low-interest loan for today’s rates.

Consequently, the NAR has repeatedly stated that inventories for sale are low by historical standards, and the lid on supply more than balances out the big drop in sales.

Eventually, life’s circumstances may encourage more homeowners to list. A drop in mortgage rates could do the same, unlocking supply, even as it may bring buyers, who are now sidelined by high prices and high mortgage rates, into the market. For now, prices remain high.

author avatar
Mark Chandik

Reproduction Prohibited without Express Permission. Copyright FDP Wealth Management. All rights reserved. Advisory Services offered through FDP Wealth Management, LLC, a state Registered Investment Adviser and Valmark Advisers, Inc. a SEC Registered Investment Advisor. Securities offered through ValMark Securities, Inc., Member FINRA/SIPC. 130 Springside Drive, Suite 300, Akron, OH 44333-2431 800.765.5201 Prosperity Partners and FDP Wealth Management, LLC are separate entities from ValMark Securities, Inc. and Valmark Advisers, Inc. Prosperity Partners, FDP Wealth Management, LLC, ValMark Securities, Inc., Valmark Advisers Inc., and their representatives do not offer tax advice. You should consult your tax professional regarding your individual circumstances. Indices are unmanaged and cannot be invested directly in. Past performance is not a guarantee of future results.

Indices are unmanaged and do not incur fees, one cannot directly invest in an index. You should consult your tax professional regarding your individual circumstances. This information is provided by Financial Jumble, LLC. Financial Jumble, LLC is a separate entity from ValMark Securities, Inc. and ValMark Advisers, Inc.

RELATED POSTS

A Hotter August CPI Builds Rate Hike Momentum

First, let’s clarify that any attempt to predict the Federal Reserve’s actions this week is, at best, an educated guess. Fed Chair Kevin Warsh has struck a hawkish tone, and the odds of a quarter-point increase in the fed funds rate are 87%, according to the CME Group. It was 59% on September 4.

Behind the Jobs Report

On Friday, the US Bureau of Labor Statistics (BLS) reported that nonfarm payrolls rose by a much greater-than-expected 162,000 jobs in August. The unemployment rate held steady at 4.1%.

Location Location Location

The graphic below compares the change in home prices, adjusted for inflation, for various US cities. For example, the average USA home price has topped inflation by 238% since 1948. Why has there been such a wide trajectory in prices, and why have they proven so persistent?

Rising Yields Faily to Derail Stocks

This year, the stock market has risen significantly. Lingering worries about oil prices, inflation, the war with Iran, and the possibility of an AI bubble haven’t subsided. But the economy is expanding, corporate profits have been strong, and the S&P 500 Index set a new high last week, according to the Wall Street Journal.

All Gas, No Brakes: Profits Soar in Q2

In a solid earnings season, we’d generally expect S&P 500 companies to deliver double-digit profit growth, meaning earnings growth of at least 10% versus a year ago (20% tops). That’s not a hard-and-fast rule, but it provides a useful benchmark for evaluating the strength of a quarter.