





author avatar
Mark Chandik

Feb 18, 2025

Explaining Away a Hot Inflation Report

The Consumer Prices Index, as reported by the U.S. Bureau of Labor Statistics (BLS), rose 0.5% in January; the annual rate is up 3.0% versus 2.9% in December.

The closely followed core CPI, which excludes food and energy, rose 0.4% (0.446%, nearly rounded to 0.5%), the biggest increase since April 2023. On an annual basis, the core rate rose to 3.3% in January vs 3.2% in December. It has been stuck between 3.2% and 3.3% for eight months.

On the surface, it was a discouraging report, but if we look deeper, we find some unique factors that contributed to the hotter-than-expected numbers.

To begin with, companies focus on price hikes near the beginning of the year—let’s call it the calendar effect.

We observed it last year, and it was evident in 2023 as well. We also noticed it during the low inflation years of the 2010s, as we’ll demonstrate below.

With that in mind, let’s examine the data by sorting through what the U.S. BLS and economists refer to as seasonally adjusted (SA) and nonseasonally adjusted (NSA) data.

Almost all reports, including the CPI, are published on a seasonally adjusted basis.

Why?

Factors such as the change in seasons, production cycles, model transitions, and holidays can lead to seasonal price variations.

According to the U.S. BLS, seasonal adjustments eliminate the effects of recurring seasonal influences from many economic series, including inflation, allowing analysts to identify new trends more accurately.

Let’s review the data from 2010 to 2019 and 2023 to 2024 (three years of the pandemic and supply chain distortions are excluded). While the latter includes only two periods of data, elevated inflation is a new phenomenon in the modern era. It’s all we have to work with.
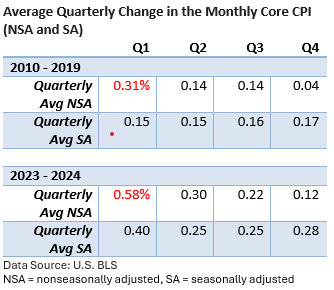
NSA price increases in Q1 are about double Q2 price hikes for both the 2010 to 2019 and 2023 to 2024 data sets.

But inflation is much higher today than it was during 2010. So, early-year price hikes are larger today.

For 2023 to 2024, we observe both a significant increase early in the year in the NSA data as well a large increase in the SA data.

If the pattern persists, expect February and March to register uncomfortably large increases followed by a moderation in price hikes in the spring and summer.

Of course, significant increases in tariffs or other economic factors could alter the pattern.

While investors are currently looking beyond what appear to be seasonal influences on the CPI, persistently high inflation could postpone or hinder further rate cuts unless an unexpected economic slowdown occurs.

author avatar
Mark Chandik

Reproduction Prohibited without Express Permission. Copyright FDP Wealth Management. All rights reserved. Advisory Services offered through FDP Wealth Management, LLC, a state Registered Investment Adviser and Valmark Advisers, Inc. a SEC Registered Investment Advisor. Securities offered through ValMark Securities, Inc., Member FINRA/SIPC. 130 Springside Drive, Suite 300, Akron, OH 44333-2431 800.765.5201 Prosperity Partners and FDP Wealth Management, LLC are separate entities from ValMark Securities, Inc. and Valmark Advisers, Inc. Prosperity Partners, FDP Wealth Management, LLC, ValMark Securities, Inc., Valmark Advisers Inc., and their representatives do not offer tax advice. You should consult your tax professional regarding your individual circumstances. Indices are unmanaged and cannot be invested directly in. Past performance is not a guarantee of future results.

Indices are unmanaged and do not incur fees, one cannot directly invest in an index. You should consult your tax professional regarding your individual circumstances. This information is provided by Financial Jumble, LLC. Financial Jumble, LLC is a separate entity from ValMark Securities, Inc. and ValMark Advisers, Inc.

RELATED POSTS

A Hotter August CPI Builds Rate Hike Momentum

First, let’s clarify that any attempt to predict the Federal Reserve’s actions this week is, at best, an educated guess. Fed Chair Kevin Warsh has struck a hawkish tone, and the odds of a quarter-point increase in the fed funds rate are 87%, according to the CME Group. It was 59% on September 4.

Behind the Jobs Report

On Friday, the US Bureau of Labor Statistics (BLS) reported that nonfarm payrolls rose by a much greater-than-expected 162,000 jobs in August. The unemployment rate held steady at 4.1%.

Location Location Location

The graphic below compares the change in home prices, adjusted for inflation, for various US cities. For example, the average USA home price has topped inflation by 238% since 1948. Why has there been such a wide trajectory in prices, and why have they proven so persistent?

Rising Yields Faily to Derail Stocks

This year, the stock market has risen significantly. Lingering worries about oil prices, inflation, the war with Iran, and the possibility of an AI bubble haven’t subsided. But the economy is expanding, corporate profits have been strong, and the S&P 500 Index set a new high last week, according to the Wall Street Journal.

All Gas, No Brakes: Profits Soar in Q2

In a solid earnings season, we’d generally expect S&P 500 companies to deliver double-digit profit growth, meaning earnings growth of at least 10% versus a year ago (20% tops). That’s not a hard-and-fast rule, but it provides a useful benchmark for evaluating the strength of a quarter.