





author avatar
Mark Chandik

Aug 4, 2025

Heavy Data Week Offers Mixed Picture

Last week was packed with economic developments, as reports poured in from all directions.

We saw the release of second-quarter Gross Domestic Product (GDP) figures, the broadest measure of goods and services produced, alongside the July jobs report. As if that weren’t enough, the Federal Reserve held its policy meeting, and strong corporate earnings continued to roll in.

Yes, there was a flurry of activity, and the overall picture was mixed at best.

Trade flows continue to whipsaw the data. While the headline showed a solid 3.0% gain, it overstated actual growth—essentially the reverse of Q1, when a 0.5% decline understated underlying activity. As the Wall Street Journal noted, it was the “Weirdest GDP Report Ever.”

Bottom line—growth has moderated in 2025, and consumer spending has slowed.

Meanwhile, the Federal Reserve kept the fed funds rate at 4.25–4.50%. Despite ongoing economic concerns, the Fed remains focused on any inflationary pressures stemming from tariffs.

The Fed kept its September rate cards close to the vest, even as Fed Chief Powell repeatedly emphasized “downside risks to the labor market”—a phrase he repeated six times during his press conference.

Elsewhere, S&P 500 Q2 earnings continue to impress and are up over 11% versus one year ago, according to LSEG (as of Aug 1). That’s nearly double the estimate as of July 1. In part, the AI story is driving earnings for big tech companies, and that spills over into S&P 500 profits.

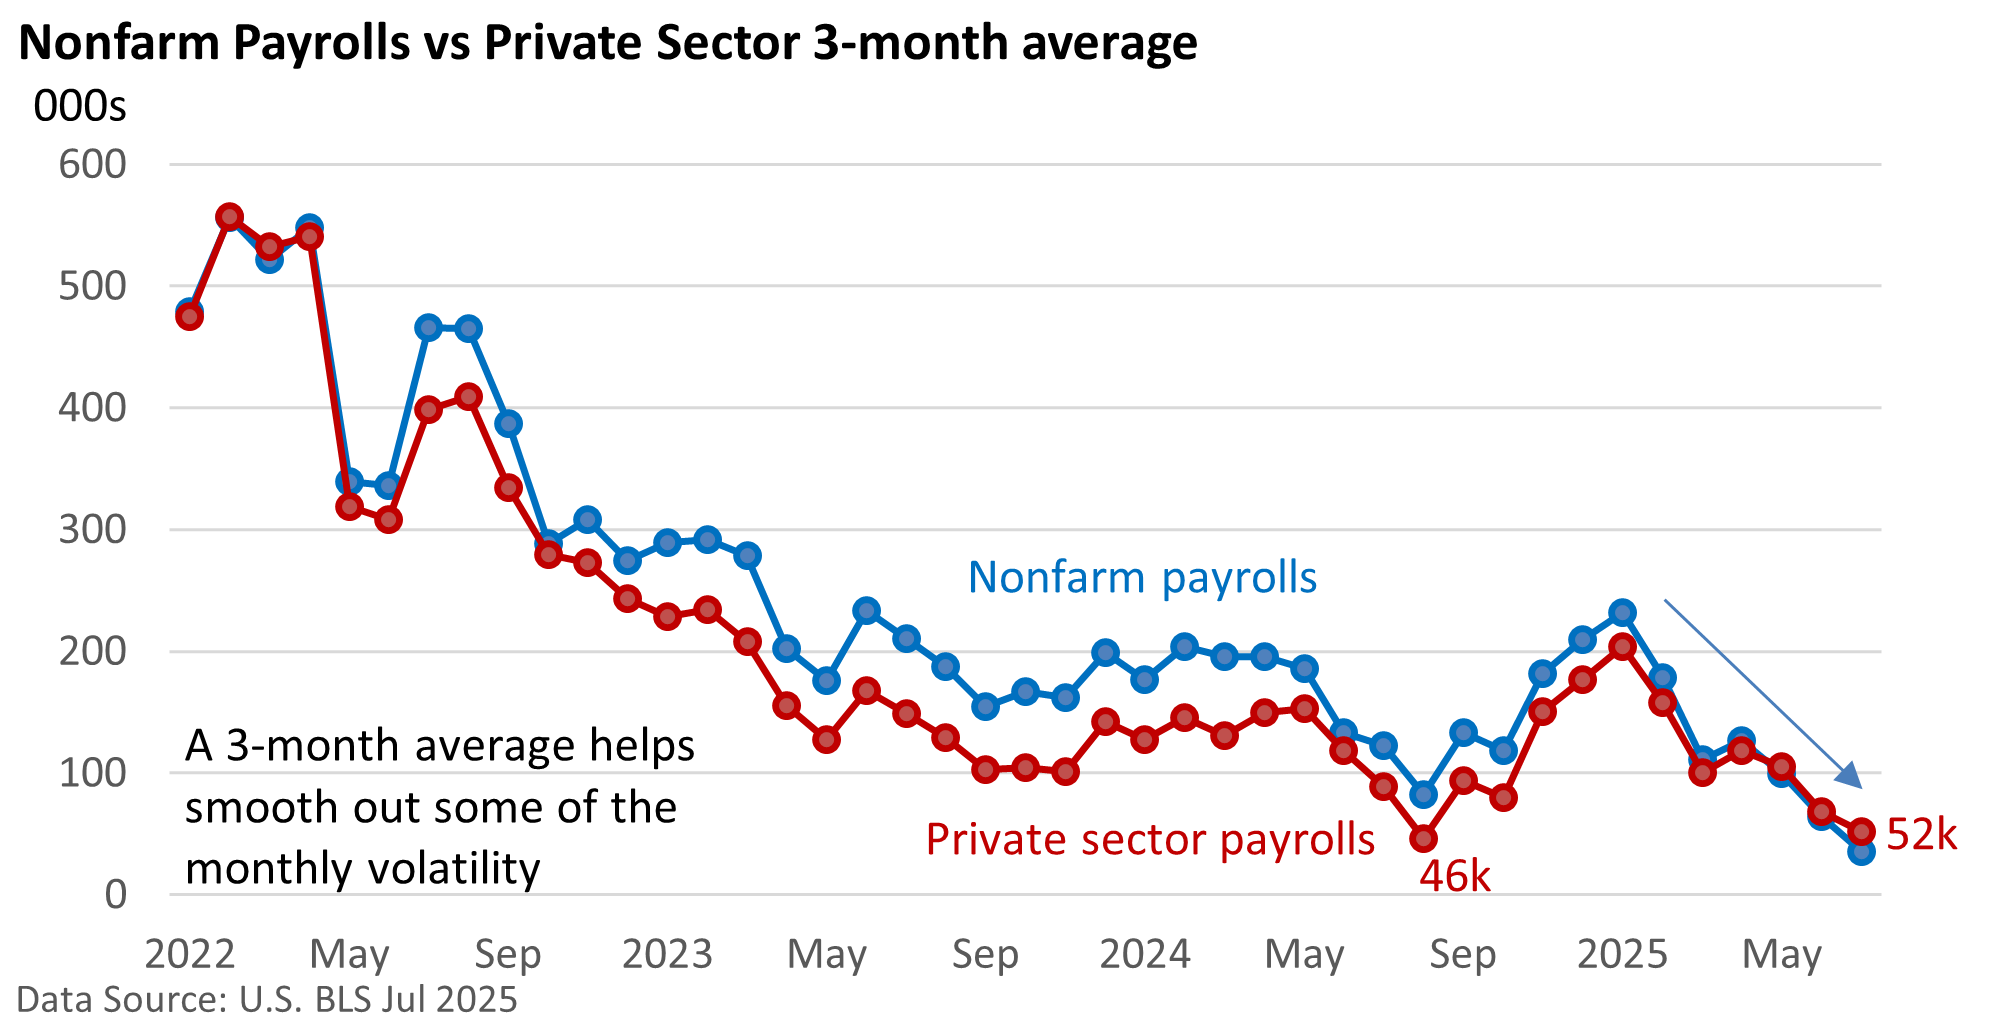
But July’s jobs report fell short of expectations. According to the US Bureau of Labor Statistics, nonfarm payrolls (includes all govt. jobs) rose a subdued 73,000 in July, with private sector gains totaling 83,000. On its own, that’s not terrible—certainly not impressive but not alarming either.

However, downward revisions to May and June—amounting to a combined 258,000—paint a more unsettling picture. Revisions are normal. The size of the revisions, however, was not. Even more striking, nearly all of July’s job growth came from a single sector: healthcare, which added 73,000 jobs. So far this year, 470,000 of the 588,000 private-sector jobs created have been in healthcare and social assistance, per to US BLS data.
author avatar
Mark Chandik

Reproduction Prohibited without Express Permission. Copyright FDP Wealth Management. All rights reserved. Advisory Services offered through FDP Wealth Management, LLC, a state Registered Investment Adviser and Valmark Advisers, Inc. a SEC Registered Investment Advisor. Securities offered through ValMark Securities, Inc., Member FINRA/SIPC. 130 Springside Drive, Suite 300, Akron, OH 44333-2431 800.765.5201 Prosperity Partners and FDP Wealth Management, LLC are separate entities from ValMark Securities, Inc. and Valmark Advisers, Inc. Prosperity Partners, FDP Wealth Management, LLC, ValMark Securities, Inc., Valmark Advisers Inc., and their representatives do not offer tax advice. You should consult your tax professional regarding your individual circumstances. Indices are unmanaged and cannot be invested directly in. Past performance is not a guarantee of future results.

Indices are unmanaged and do not incur fees, one cannot directly invest in an index. You should consult your tax professional regarding your individual circumstances. This information is provided by Financial Jumble, LLC. Financial Jumble, LLC is a separate entity from ValMark Securities, Inc. and ValMark Advisers, Inc.

RELATED POSTS

A Hotter August CPI Builds Rate Hike Momentum

First, let’s clarify that any attempt to predict the Federal Reserve’s actions this week is, at best, an educated guess. Fed Chair Kevin Warsh has struck a hawkish tone, and the odds of a quarter-point increase in the fed funds rate are 87%, according to the CME Group. It was 59% on September 4.

Behind the Jobs Report

On Friday, the US Bureau of Labor Statistics (BLS) reported that nonfarm payrolls rose by a much greater-than-expected 162,000 jobs in August. The unemployment rate held steady at 4.1%.

Location Location Location

The graphic below compares the change in home prices, adjusted for inflation, for various US cities. For example, the average USA home price has topped inflation by 238% since 1948. Why has there been such a wide trajectory in prices, and why have they proven so persistent?

Rising Yields Faily to Derail Stocks

This year, the stock market has risen significantly. Lingering worries about oil prices, inflation, the war with Iran, and the possibility of an AI bubble haven’t subsided. But the economy is expanding, corporate profits have been strong, and the S&P 500 Index set a new high last week, according to the Wall Street Journal.

All Gas, No Brakes: Profits Soar in Q2

In a solid earnings season, we’d generally expect S&P 500 companies to deliver double-digit profit growth, meaning earnings growth of at least 10% versus a year ago (20% tops). That’s not a hard-and-fast rule, but it provides a useful benchmark for evaluating the strength of a quarter.