




author avatar
Mark Chandik

Oct 28, 2024

The Interest Rate Paradox

Last month, the Federal Reserve reduced its key interest rate, and the consensus suggested (and still suggests) that the Fed will cut rates two more times before the year ends.

A closely watched tool from the CME Group is pricing in a quarter-point rate cut at the November 7th Fed meeting, and it favors another quarter-point rate cut at the December 18th meeting.

Of course, there is no guarantee that this will happen, but if the Fed reduced the fed funds rate last month, and the consensus signals additional rate cuts are in the pipeline, why have bond yields started to back up?

The graphic below plots yields on Treasuries from 1 month to 30 years. The red line represents yields on September 18, the day the Federal Reserve reduced the fed funds rate. The blue line displays yields about 5 weeks later—October 24.
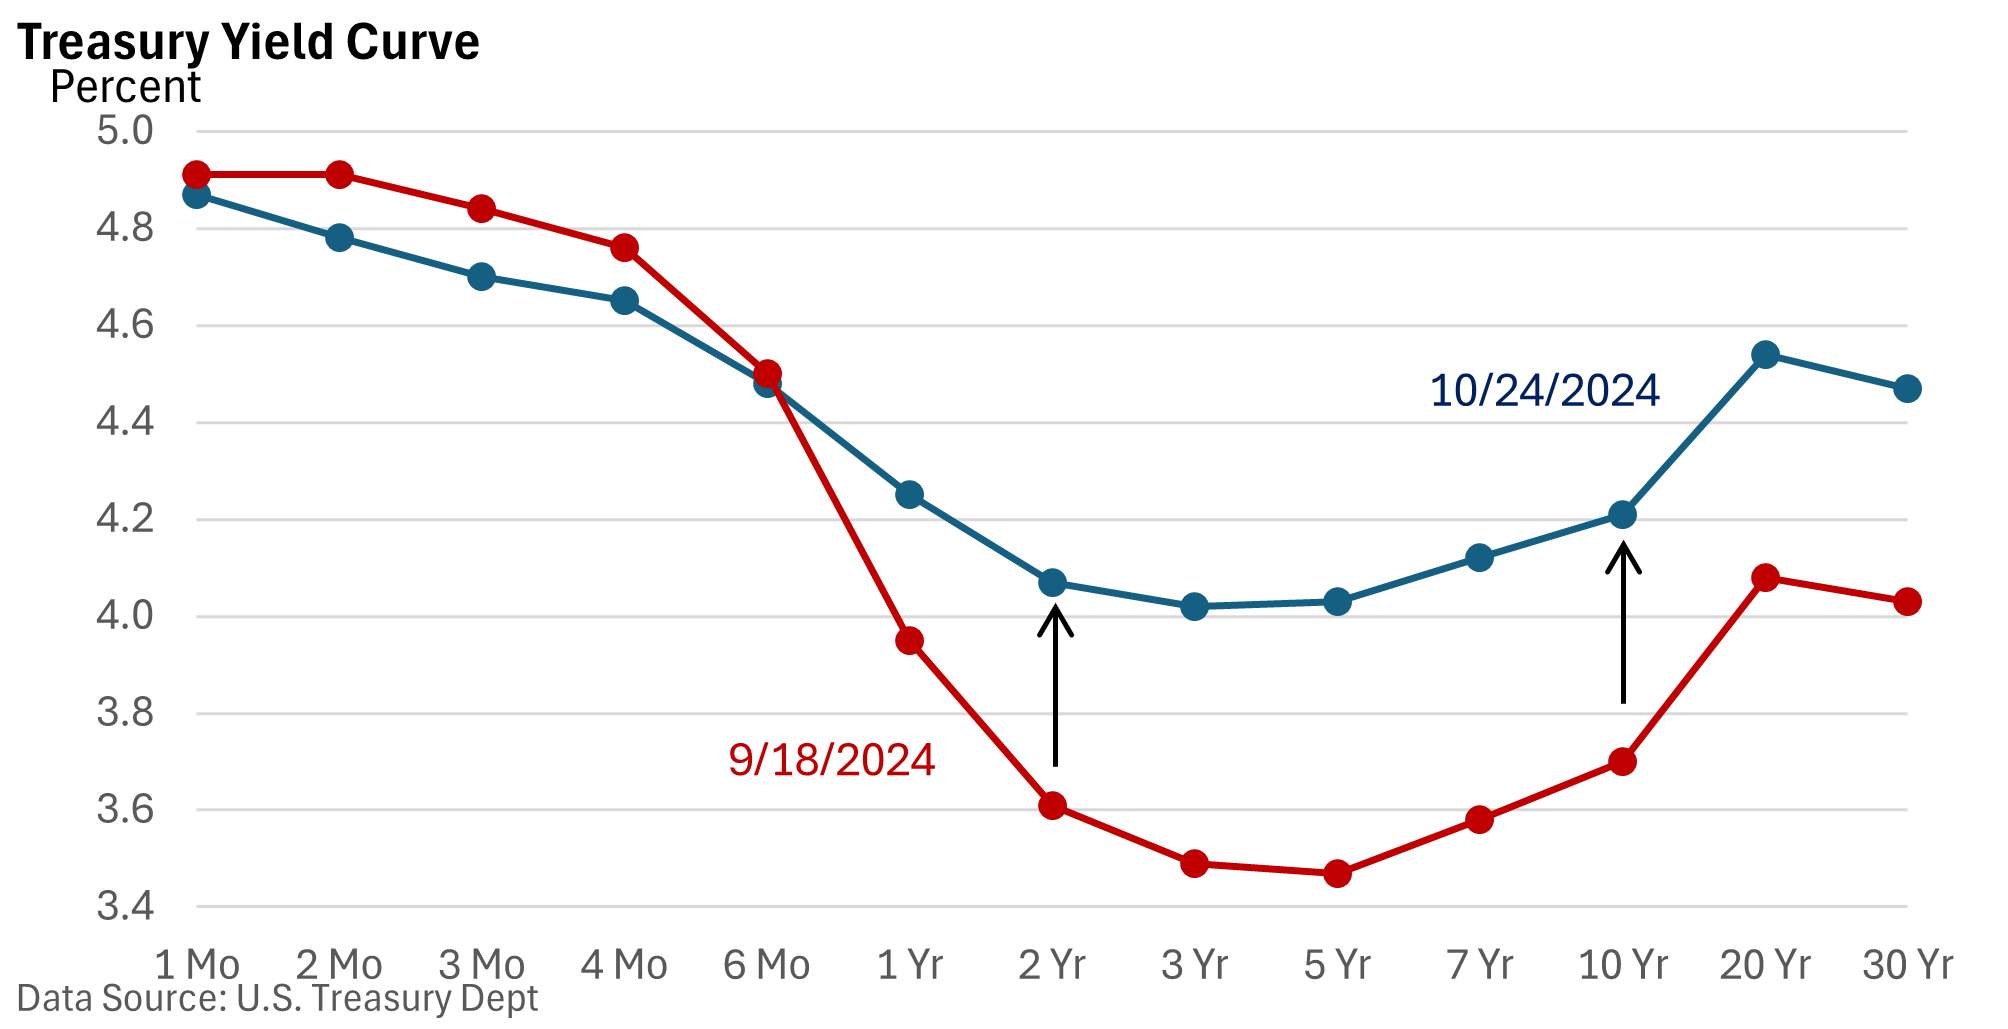
Yields are down for short-term T-bills: 1 – 4 months. In contrast, yields are up significantly across much of the curve (1 year to 30 years). So, what gives?

  1. Bond investors are rethinking how aggressively the Fed will reduce interest rates. Talk of another half-percentage point cut in November is currently off the table. While odds favor a reduction in December, there is some chatter that the Fed could pause at the December meeting.
  2. Economic resilience—job growth in September was much better than expected, according to Bloomberg News, and the prior two months were revised higher. Recent data reflect an economy that is performing admirably, while the jobless rate remains low. Consequently, aggressive rate cuts aren’t needed right now.
  3. Large budget deficits translate into a greater supply of bonds that must be issued.

Consequently, investors have been re-pricing their outlook for bonds, surprising many who had expected yields to continue their decline or, at a minimum, stabilize near mid-September levels.

We may be having a completely different conversation later this year or early next year, as economic data can surprise either to the upside (as it is now) or disappoint. We’ll get a better read on Q3 on Wednesday when GDP is released. The October jobs report prints on Friday.

author avatar
Mark Chandik

Reproduction Prohibited without Express Permission. Copyright FDP Wealth Management. All rights reserved. Advisory Services offered through FDP Wealth Management, LLC, a state Registered Investment Adviser and Valmark Advisers, Inc. a SEC Registered Investment Advisor. Securities offered through ValMark Securities, Inc., Member FINRA/SIPC. 130 Springside Drive, Suite 300, Akron, OH 44333-2431 800.765.5201 Prosperity Partners and FDP Wealth Management, LLC are separate entities from ValMark Securities, Inc. and Valmark Advisers, Inc. Prosperity Partners, FDP Wealth Management, LLC, ValMark Securities, Inc., Valmark Advisers Inc., and their representatives do not offer tax advice. You should consult your tax professional regarding your individual circumstances. Indices are unmanaged and cannot be invested directly in. Past performance is not a guarantee of future results.

Indices are unmanaged and do not incur fees, one cannot directly invest in an index. You should consult your tax professional regarding your individual circumstances. This information is provided by Financial Jumble, LLC. Financial Jumble, LLC is a separate entity from ValMark Securities, Inc. and ValMark Advisers, Inc.

RELATED POSTS

A Hotter August CPI Builds Rate Hike Momentum

First, let’s clarify that any attempt to predict the Federal Reserve’s actions this week is, at best, an educated guess. Fed Chair Kevin Warsh has struck a hawkish tone, and the odds of a quarter-point increase in the fed funds rate are 87%, according to the CME Group. It was 59% on September 4.

Behind the Jobs Report

On Friday, the US Bureau of Labor Statistics (BLS) reported that nonfarm payrolls rose by a much greater-than-expected 162,000 jobs in August. The unemployment rate held steady at 4.1%.

Location Location Location

The graphic below compares the change in home prices, adjusted for inflation, for various US cities. For example, the average USA home price has topped inflation by 238% since 1948. Why has there been such a wide trajectory in prices, and why have they proven so persistent?

Rising Yields Faily to Derail Stocks

This year, the stock market has risen significantly. Lingering worries about oil prices, inflation, the war with Iran, and the possibility of an AI bubble haven’t subsided. But the economy is expanding, corporate profits have been strong, and the S&P 500 Index set a new high last week, according to the Wall Street Journal.

All Gas, No Brakes: Profits Soar in Q2

In a solid earnings season, we’d generally expect S&P 500 companies to deliver double-digit profit growth, meaning earnings growth of at least 10% versus a year ago (20% tops). That’s not a hard-and-fast rule, but it provides a useful benchmark for evaluating the strength of a quarter.