by Mark Chandik | Oct 5, 2026
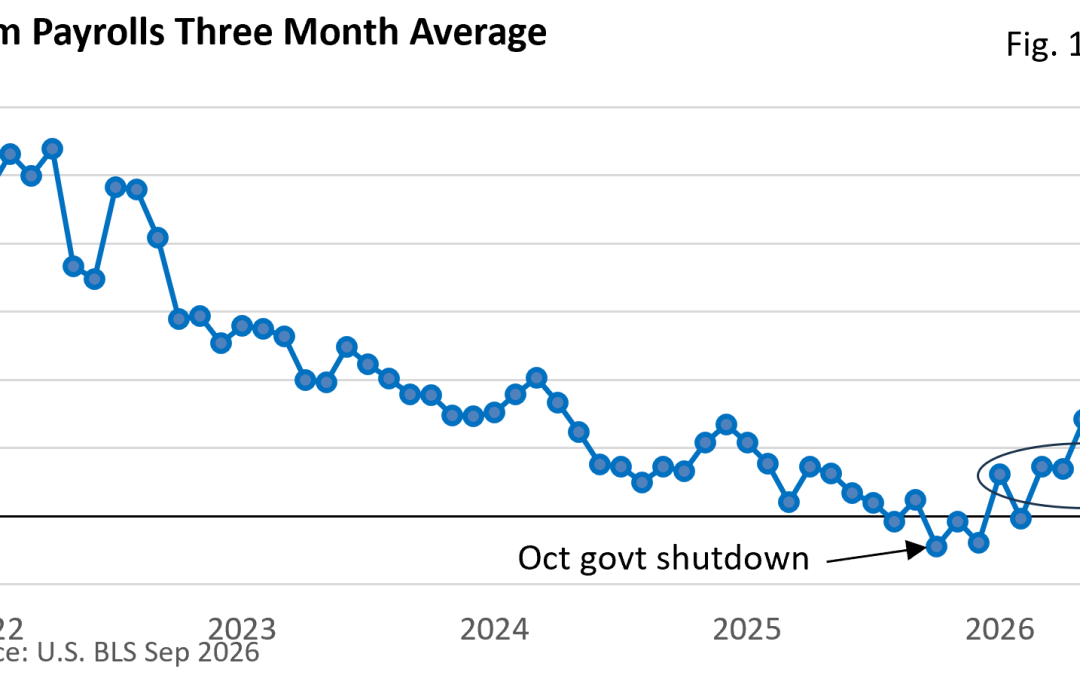
Released by the US Bureau of Labor Statistics (BLS), September’s nonfarm payroll report came in lighter than expected, and the unemployment rate unexpectedly inched higher. How did investors react? Favorably. The disappointing report reduced the odds of a late-October...
by Mark Chandik | Sep 28, 2026
“Bond Selloff Deepens After 30-Year Yield Hits Highest Level Since 2004,” declared Bloomberg News last week. CNBC echoed the sentiment with “10-Year Treasury Yield Rockets to 19-Year High.” What’s driving the recent rise in Treasury yields (bond prices and yields move...
by Mark Chandik | Sep 21, 2026
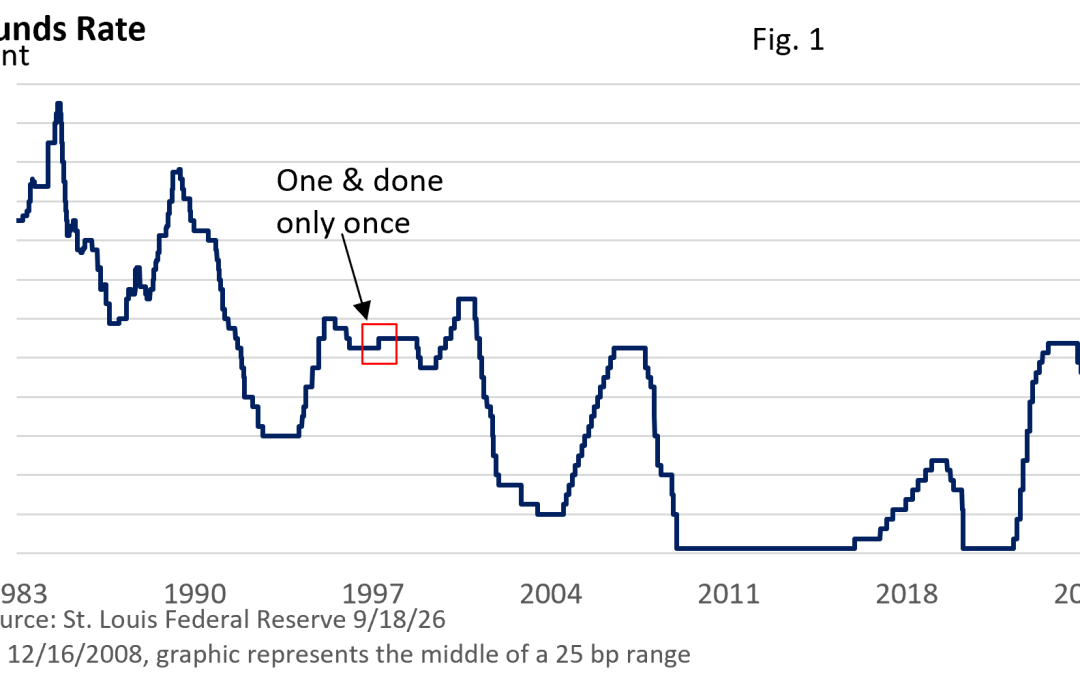
First, let’s clarify that any attempt to predict the Federal Reserve’s actions this week is, at best, an educated guess. Fed Chair Kevin Warsh has struck a hawkish tone, and the odds of a quarter-point increase in the fed funds rate are 87%, according to the CME...
by Mark Chandik | Sep 15, 2026
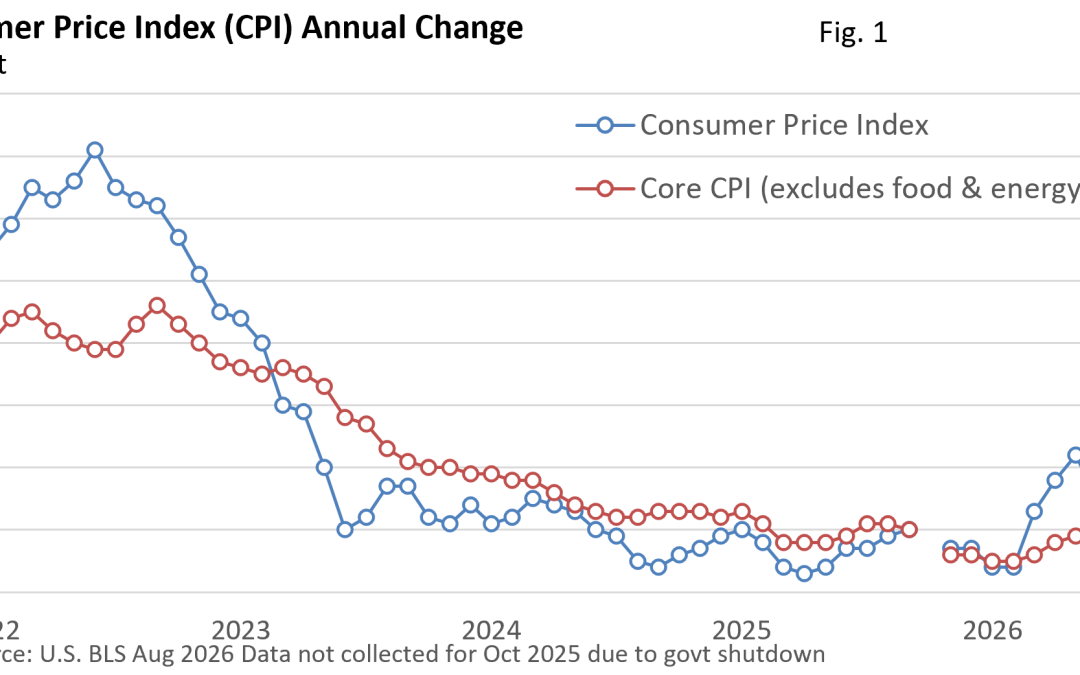
First, let’s clarify that any attempt to predict the Federal Reserve’s actions this week is, at best, an educated guess. Fed Chair Kevin Warsh has struck a hawkish tone, and the odds of a quarter-point increase in the fed funds rate are 87%, according to the CME...
by Mark Chandik | Sep 8, 2026
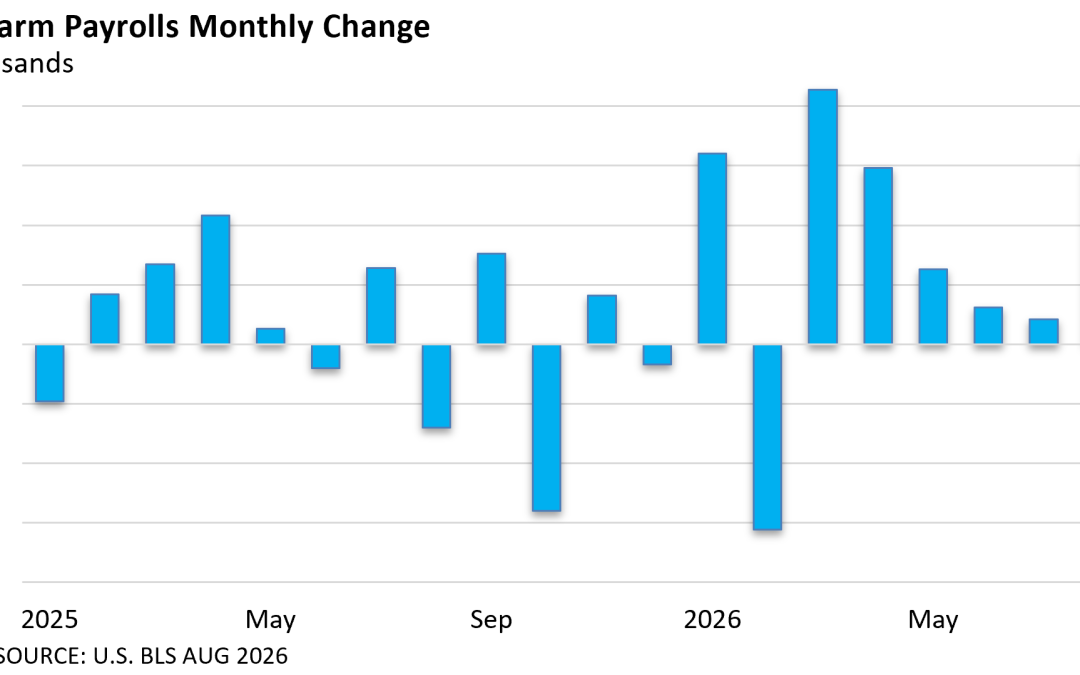
On Friday, the US Bureau of Labor Statistics (BLS) reported that nonfarm payrolls rose by a much greater-than-expected 162,000 jobs in August. The unemployment rate held steady at 4.1%. On the surface, it’s a strong number, coming in at more than triple expectations....
by Mark Chandik | Aug 31, 2026
The graphic below compares the change in home prices, adjusted for inflation, for various US cities. For example, the average USA home price has topped inflation by 238% since 1948. Note that yields briefly snuck under 4% just before the war started. In part, blame...